- Summary:
- Bitcoin prices are in a corrective phase, but many people want to know how far this correction could go. The outlook for BTCUSD explains things.
Yesterday’s steep drop in Bitcoin prices bothered a lot of people, who got sucked in by all the juicy predictions made by the “gurus”. I came across a lady who invested $1,000 in both Bitcoin and Ethereum on Friday and was lamenting at how her funds were depreciating.
This showcases an important lesson. Never buy at a top. Do not believe the predictions you see flying around. Prices always move in a zigzag fashion. Even when prices are trending upwards, there will impulse waves and corrective phases. Right now, Bitcoin prices are in a corrective phase. But how far can we expect the correction to last?
Technical Outlook for Bitcoin Prices
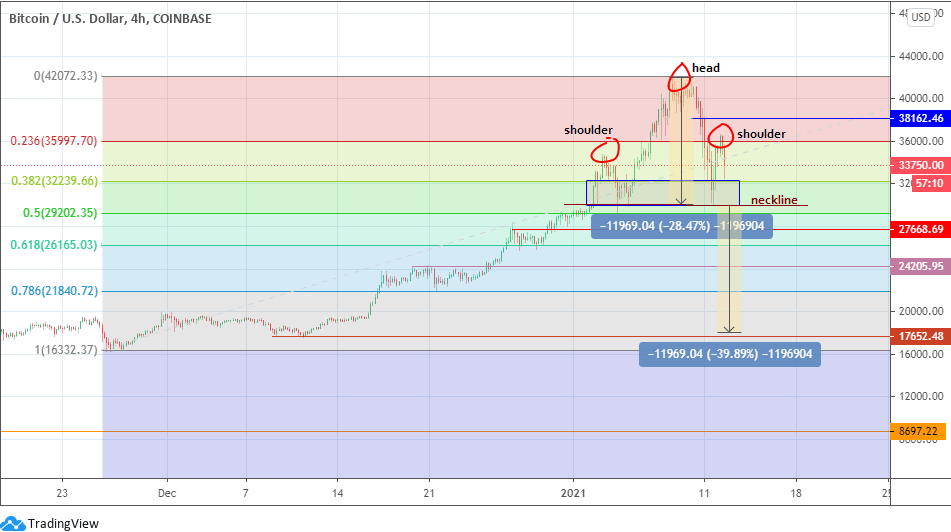
The outlook for today comes from the 4-hour chart. Here, we can see that Bitcoin prices are still in correction mode, with price approaching an intraday support (38.2% Fibonacci level) located at 32239.66. Below this area, additional support is found at the 30,000 mark (Monday’s low). This price marks the floor of the support zone, as well as the neckline of the head and shoulders pattern.
A breakdown of this price level allows Bitcoin prices to pursue a price projection point at 18028.66. However, this move has to take out several support levels at 27668.69, 26,165.03 24205.95 and also 21840.72, to materialize. This could take weeks or months if indeed it will happen.
On the flip side, bargain hunters could see any of these points as possible areas to carry out dip-buying on BTCUSD, as the pair remains in an uptrend, technically speaking. A return of dip-buying pursues targets at 36,000, 38162.46 and the all-time high at 42072.33. Clearance of the all-time high could see a pursuit of the 423.6% Fibonacci extension level at 45972.96.
BTCUSD 4-hour Chart


