- Summary:
- The Warner Bros Discovery stock price has been in a strong sell-off in the past few months as demand for media and streaming stocks crash.
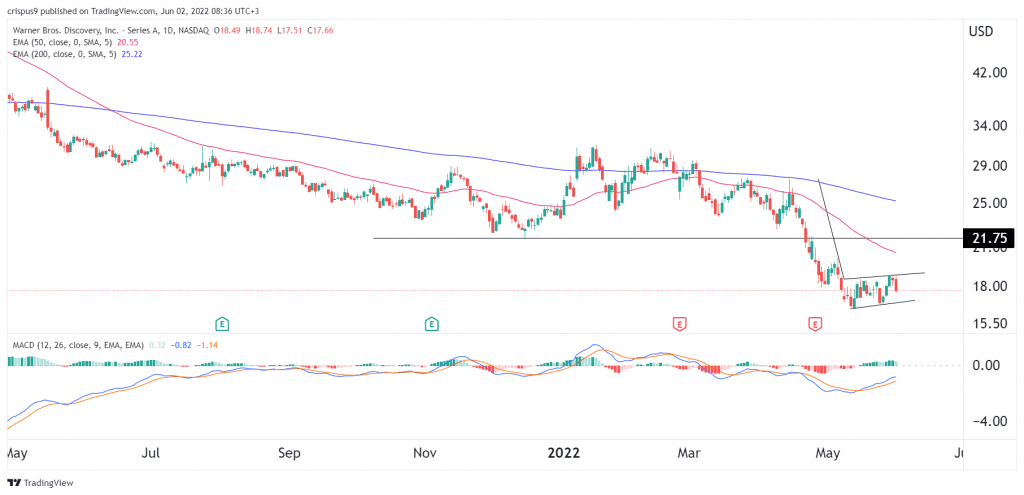
The Warner Bros Discovery stock price has been in a strong sell-off in the past few months as demand for media and streaming stocks crash. The WBD stock is trading at $17.66, which is the lowest it has been since March 2020. It has fallen by more than 78% below the highest point in 2021, bringing its total market cap to over $42 billion.
Streaming stocks slump
Warner Bros Discovery is one of the newest media companies. It was formed two months ago after the merger of Discovery and Warner Bros, a company that was owned by AT&T. Today, the company owns many well-known brands like HGTV, CNN, HBO, TNT, and Magnolia Network among others. It makes its money through subscriptions, advertising, and blockbuster movie tickets.
The Warner Bros Discovery stock price has declined as part of the broader sell-off in the industry. Netflix, the market leader in the sector, has slipped by more than 70% from its all-time high. Similarly, the Paramount stock price has crashed by over 67% from ATH. The concern is that the companies demand will decline as more people move back to work.
Also, the rising competition from companies like Disney, Apple, and Peacock has risen. At the same time, the collapse of the Netflix stock price has pushed more people away from streaming shares. The WBD stock price declined even after the company tapped Mike De Luca and Pam Abdy to lead Warner Bros. Pictures Group.
These are two veterans in Hollywood with their recent posts being at MGM Motion Picture Group. This restructuring is part of the company’s plan to slash costs by over $3 billion in the coming years. On a positive note, the put-to-call ratio has dropped to 0.1558, which is a bullish sign.
Warner Bros Discovery stock price forecast
The daily chart shows that the WBD share price has been in a strong bearish trend in the past few months. A closer look shows that the stock has formed a bearish flag pattern that is shown in black. In price action analysis, this pattern is usually a sign that an asset will have a bearish breakout. The stock remains below the 25-day and 50-day moving averages.
Therefore, the outlook of the shares is still bearish, with the next key support level being at $15. A move above the resistance at $19 will cancel the bearish view.


