- Summary:
- walmart share price has risen by more than 3 percent in the last five days. Although the company stocks are in a long-term bearish trend.
Walmart’s share price has risen by more than 3 per cent in the last five days. Although the company stocks are in a long-term bearish trend, the current price gain looks set to reverse it.
Walmart Financial Reports
Walmart posted a strong financial report in the fourth quarter of 2021. The report showed the company had revenue of $152 billion. A significant increase from the third quarter of 2021 was $140 billion. The company also recorded a net income of $3.56 billion, significantly increasing from $3.1 billion in the third quarter.
The company’s balance sheet for the fourth quarter was also strong, with the company recording an asset to debt ratio of 62.47 per cent. The balance sheet also showed the company had assets worth $244 billion and liabilities worth $152 billion.
Walmart Share Price Prediction
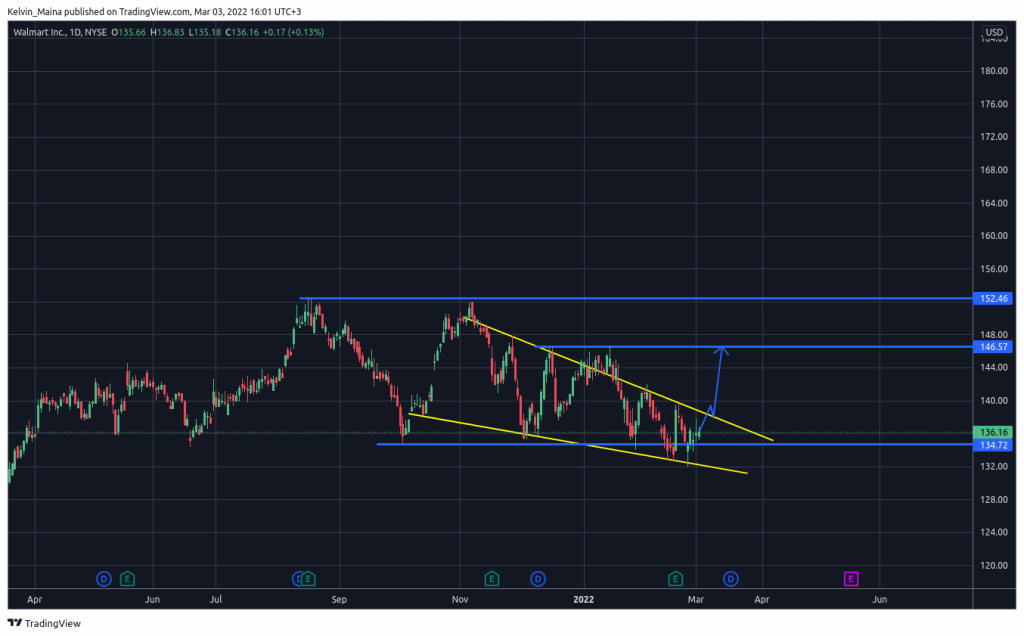
Walmart’s share price has risen for five consecutive days, recording an increase of 3 per cent during that period. Looking at the daily chart, we can see that Walmart’s share prices have been trading within two trading structures, the support and resistance structure and the falling wedge trading pattern.
The two descending yellow trendlines represent the falling wedge trading pattern in the chart below. When the falling wedge pattern starts forming on a chart, it signals a trend reversal. So, the current falling wedge in the Walmart daily chart is a technical indicator of a strong bullish move reversal. This is supported by the support and resistance levels of $134 and 146, respectively.
Currently, the prices are bouncing from the support level, and I expect the prices to continue rising until they hit the $146 resistance level. However, if the prices fall below the support level, it will mean that the reversal has failed. This will also mean my trade analysis has been invalidated, and the bearish trend will continue.
Walmart Daily Chart


