- Summary:
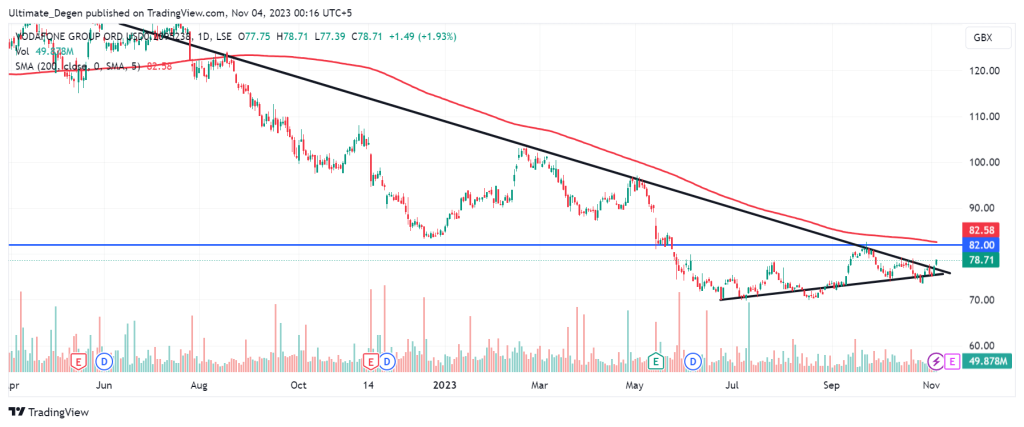
- Vodafone Share Price Forecast: LON: VOD seems to have broken out of the downtrend. Bulls may now target 82p next.
Vodafone (LON: VOD) share price retests its October highs as the EU Commission gives the green light to its merger with CK Hutchinson. The commission got concerned about the $19 billion merger, which might reduce the competition in the UK.
This is because the merger will reduce the number of networks from four to three. However, the regulator found no issues with the merger and is likely to approve it after reviewing the deal by December.
The FTSE 100 index slid 40 points on Friday at the market close despite Vodafone gaining over 1.7% on the last trading day of the week. This move comes after the Bank of England announced no change in its interest rates earlier this week. At the time of writing, the shares of Vodafone were changing hands at 78.26p and were up 4% from its weekly low.
Vodafone Gets Regulatory Nod For Merger
Vodafone recently also signed an agreement with Zegona Communications over the sale of Vodafone’s Spanish division. The British telecom company is set to receive €5 billion from the proceedings, which comprises €4.1 billion in cash and €0.9 billion in Redeemable Preference Shares. Zegona will be able to use Vodafone’s brand name for up to 10 years after the completion of the acquisition.
According to Russ Mould, Vodafone still needs to simplify its business operations despite divesting from its Spanish division. This could be achieved by winding down its business in a few markets while also maintaining strict cost control.
The analyst expressed concern for the telecom giant’s future, as Vodafone share price is doomed to see more downside in case of slow growth.

Vodafone Share Price Technical Analysis
The price of LON: VOD has finally squeezed broken above the symmetrical triangle pattern. This price action depicts that the bulls are in action as they target the 82p level. However, this Vodafone share price forecast depends on the bulls’ ability to retain the current bullish pressure.
The chart also reveals the 200 MA level, which has the potential to act as a dynamic resistance level provided that the price breaks above the 82p resistance first. Furthermore, there are also strong chances for the price to see a slight pullback and retest the downward trend line for support to confirm its breakout.


