- Summary:
- The Vechain price has spent two weeks coiled like a spring between the key moving averages, which could lead to a bullish breakout.
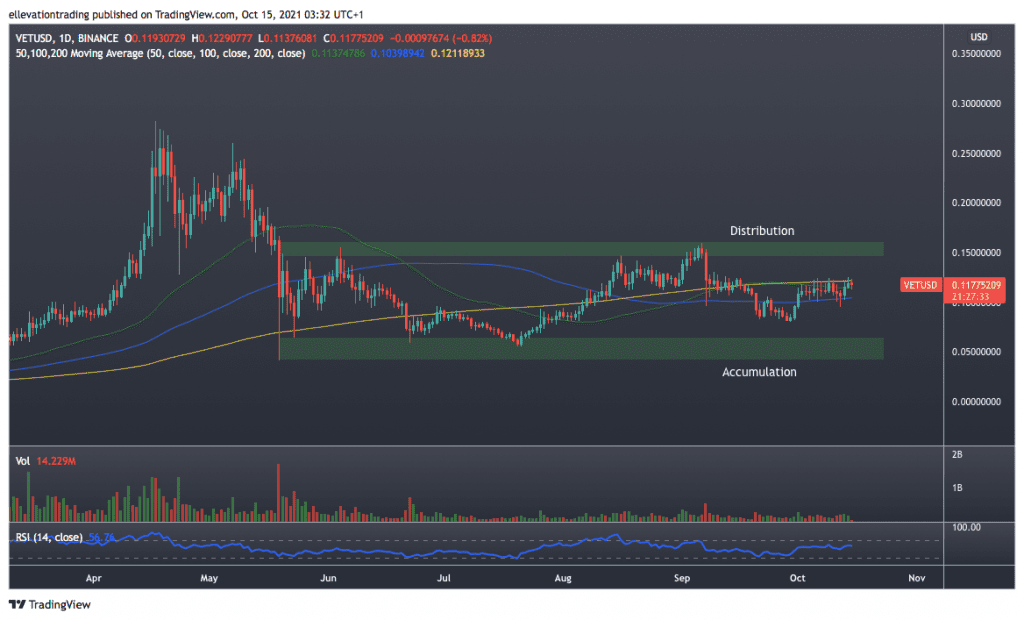
The Vechain price has spent two weeks coiled like a spring between the key moving averages, which could lead to a bullish breakout. Like many altcoins, Vechain’s native token VET is struggling for a catalyst in either direction. For the most part, Vechain has ignored Bitcoin’s furious rally to $59,000 and remains capped by the 200-day moving average at $0.1211. However, VET is showing persistence, and this morning is exerting pressure against the long-term indicator.
VeChain, the blockchain-powered supply chain platform, recovered well from the summer lows. Between the 31st of July and the 6th of September, the VET token improved by 180% to $0.1594. On the 7th, VeChain suffered heavy liquidation as the Evergrande debt crisis spilt over into cryptocurrencies. The VET price slid 35% intraday before paring the loss to -20%. However, China’s enhanced crypto ban on the 20th encouraged more selling, and VET finished the month 40% below the high. Confidence has returned in October, and Vechain has gained around $47%, although the 200-day moving average has constantly rejected efforts to advance higher.
VET price
The daily chart shows the VeChain price is trading at $0.1179, sandwiched between the 100-day moving average at $0.1039, and the 200-DMA at $0.1211. Until either gives way, a direction is unclear. However, momentum appears to be building for clearance of the 200 DMA. Successful uncapping of the average should see the price extend towards September’s $0.1594 high.
On the other hand, if VET slides below the 100-DMA, bearish momentum could drive the price back to the late September lows around $0.0810. Furthermore, a deeper correction would target the July low at $0.0570. For now, I maintain a neutral-to-bullish stance, favouring the upside. The optimistic view remains relevant above the 100-DMA. Therefore, if VET falls below $0.1039, it invalidates this thesis.
VeChain Price Chart (Daily)

For more market insights, follow Elliott on Twitter.


