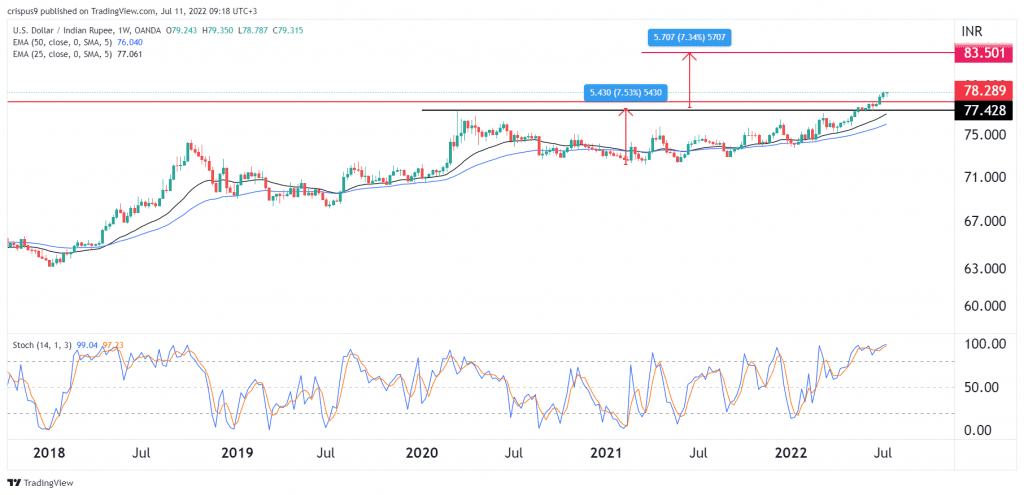
- The USD/INR price surged to an all-time high on Monday morning as investors reacted to the strong American jobs data.
The USD/INR price surged to an all-time high Monday morning as investors reacted to the strong American jobs data. The USD to INR also rose ahead of the upcoming Indian industrial production data and the latest US consumer inflation numbers. It is trading at 79.30, which is about 6.65% above where it started the year. The pair has surged by over 23% in the past 24 years.
Indian rupee crash to continue
The USD/INR price continued rising as investors react to the strong American jobs data. According to the Bureau of Labor Statistics (BLS), the American economy created more than 372k jobs in June this year. In the same period, the unemployment rate remained unchanged at 3.6%.
Therefore, investors expect the Federal Reserve to continue hiking interest rates in the coming months. It is expected to hike by about 0.75% rate hike this month. In addition, the US will publish the latest consumer inflation data on Wednesday. Analysts expect the country’s inflation to surged to the highest level in over 40 years.
The USD to INR price will next react to the upcoming Indian industrial production data. Analysts expect the data to show that the country’s production rose from 7.1% to over 20% in May. Like the Fed, the Reserve Bank of India (RBI) is expected to continue hiking interest rates in its bid to fight the soaring inflation.
USD/INR price prediction
The weekly chart shows that the USDINR pair has been in a strong bullish trend in the past few days. As a result, the pair has managed to move above the important resistance level at 78.28, which was the highest point in March 2020. In addition, it has risen above the 25-week and 50-week moving averages.
At the same time, the pair has formed what looks like a cup and handle pattern. In price action analysis, this pattern is usually a bullish sign. In addition, the Stochastic Oscillator has moved above the overbought level. Therefore, I suspect the bullish trend will continue with the next key level to watch for the USD/INR being 83.50. A move below the support at 77.42 will invalidate the bullish view.


