- Summary:
- The USD/RUB price came under intense pressure even as tensions between western countries and Russia continued.
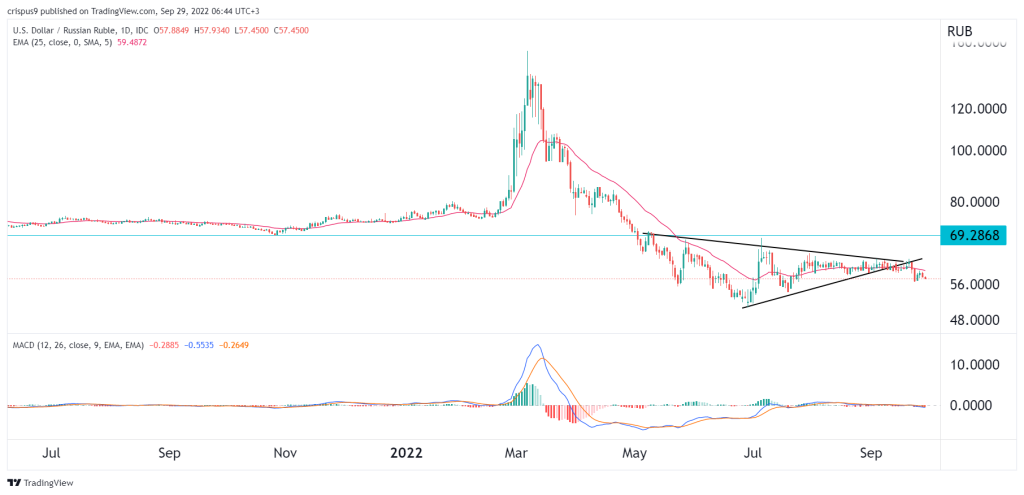
The USD/RUB price came under intense pressure even as tensions between western countries and Russia continued. It was trading at 57.45 on Thursday, which was slightly above the year-to-date low of 51. It is still much lower than the highest point this year, meaning that the Russian ruble has done substantially better than most countries.
Crude oil and gas prices
The USD/RUB price remained in a tight range as focus remained on the ongoing war in Ukraine. This week, Russia declared victory in sham referendums in four occupied regions in the country. At the same time, a Nord Stream gas leak led to tensions between Russia and other western countries. It is still unclear who caused the leaks.
The USD/RUB is also reacting to the performance of oil and gas. Crude oil prices crashed this week as worries about demand continued. Brent is trading at $87 while West Texas Intermediate (WTI) was trading at $82. In most cases, the Russian ruble does better in a period of high oil prices since it leads to more foreign exchange.
Falling oil prices have been offset by relatively elevated natural gas prices. European gas prices surged this week after the gas leaks. As such, while Russia is not shipping a lot of gas to Europe anymore, the country is receiving much money as prices rise.
The USD to RUB exchange rate will next react to the upcoming US GDP data. The final estimates of the numbers are expected to show that the country’s economy sank into a recession in Q2.
USD/RUB forecast
The daily chart shows that the USDRUB price has been in a tight range in the past few days. Notably, it managed to move below the symmetrical triangle pattern that is shown in black. This is a sign that there are more buyers of the Russian ruble even as the US dollar index surges. It has moved slightly below the 25-day moving average.
Therefore, there is a likelihood that the USD/RUB price will have a bearish breakout soon. If this happens, the next key level to watch is the year-to-date low of 50.2. A move above the resistance at62.6 will invalidate the bearish view.


