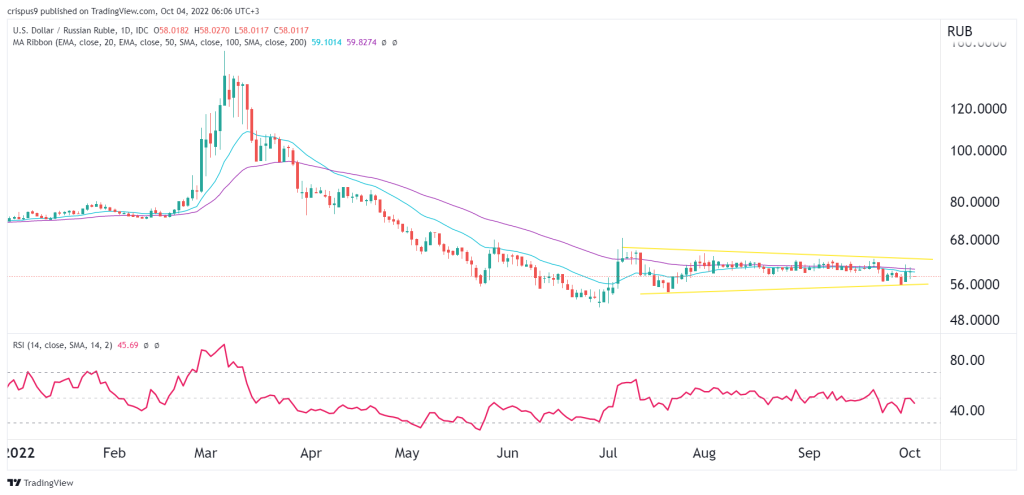
- The USD/RUB price has been stuck in a narrow range in the past few weeks as investors reflect on a number of factors.
The USD/RUB price has been stuck in a narrow range in the past few weeks as investors reflect on a number of factors. It was trading at 58.02 on Tuesday morning, which was slightly higher than this week’s low of 55.55. This price is still about 62% below the highest level this year.
Is the Russian ruble a good buy?
The USD to ruble exchange rate has crashed hard during the Russia-Ukraine war. This performance happened due to strict currency control mechanisms by the Russian government and elevated oil and natural gas prices. Russia also ordered Europe and its allied countries to start paying for gas contracts using the currency.
Further, while Russia has reduced the volume of natural gas that it sends to Europe, it is earning substantial resources as prices rise. European gas prices have more than doubled this year and are expected to remain high during the war.
The next key catalyst for the USD/RUB will be the upcoming OPEC+ meeting. According to the WSJ, the cartel is expected to dramatically reduce its output in a bid to push oil prices higher. The rumor is that the cartel will slash output by more than 1 million barrels starting from next month. Higher prices will also benefit the Russian ruble since the country sells millions of barrels per day.
The USD/RUB exchange rate will also react to the upcoming US non-farm payrolls (NFP). Analysts expect the data to show that the American economy added thousands of jobs in September while the unemployment rate remained at 3.8%.
USD/RUB forecast
On the daily chart, we see that the USD/RUB price has been in a tight range in the past few days. As a result, the pair is hovering at the 25-day and 50-day moving averages. It has also formed a symmetrical triangle pattern that is shown in yellow while the Relative Strength Index (RSI) has moved slightly below the neutral point of 50.
Now, with the triangle pattern nearing its confluence level, there is a likelihood that the pair will have a major breakout in either direction. My view is that it could have a bearish breakout as sellers target the next key support at 50. A move above the resistance level at 62 will invalidate the bearish view.


