- Summary:
- Today's trading session has seen Tron price rising for a third consecutive day. This is a 22 percent in the past three weeks
Today’s trading session has seen Tron’s price rising for a third consecutive day. After dropping more than 22 percent in the past three weeks and over 60 percent since November 20, 2021.
Is Tron underperforming?
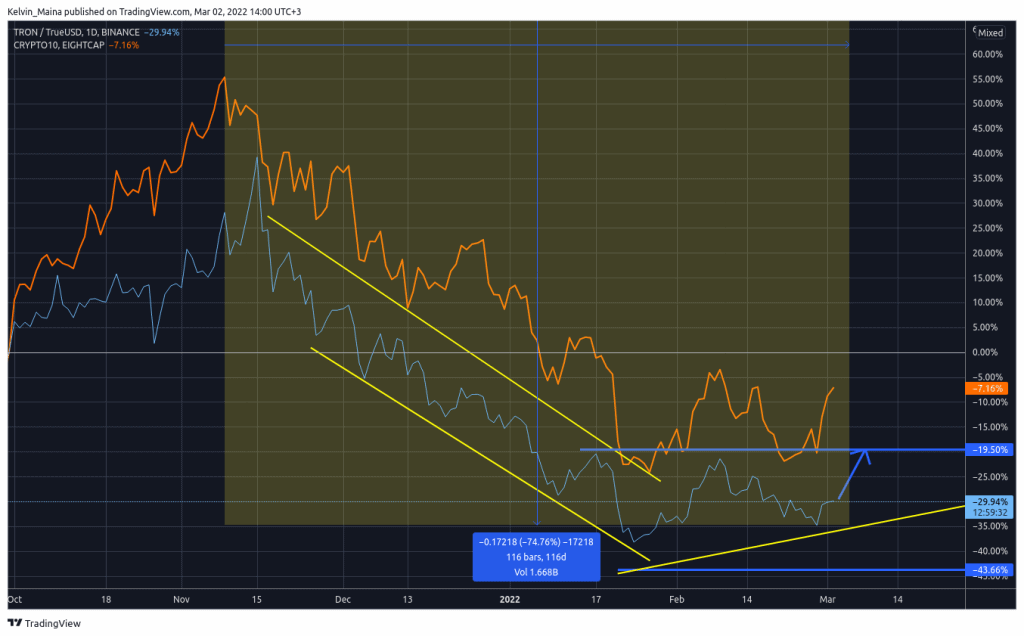
Since October of last year, Tron has continually underperformed the Crypto 10 index. The index which encompasses the trend and value of the top 10 cryptocurrencies based on their market cap is a widely accepted benchmark used to compare the performance of cryptocurrencies.
However, looking at the comparison between the Crypto 10 index and Tron prices, the chart below shows they are positively correlated. This means that Tron has taken the same trend pattern as the Crypto 10 index. In the most recent prices, the Crypto 10 index has aggressively moved upwards whereas Tron is currently underperforming the index. In the chart below, Tron is represented by the blue line whereas Crypto index is the orange line graph.
Crypto 10 Index Vs Tron

Tron Price Prediction
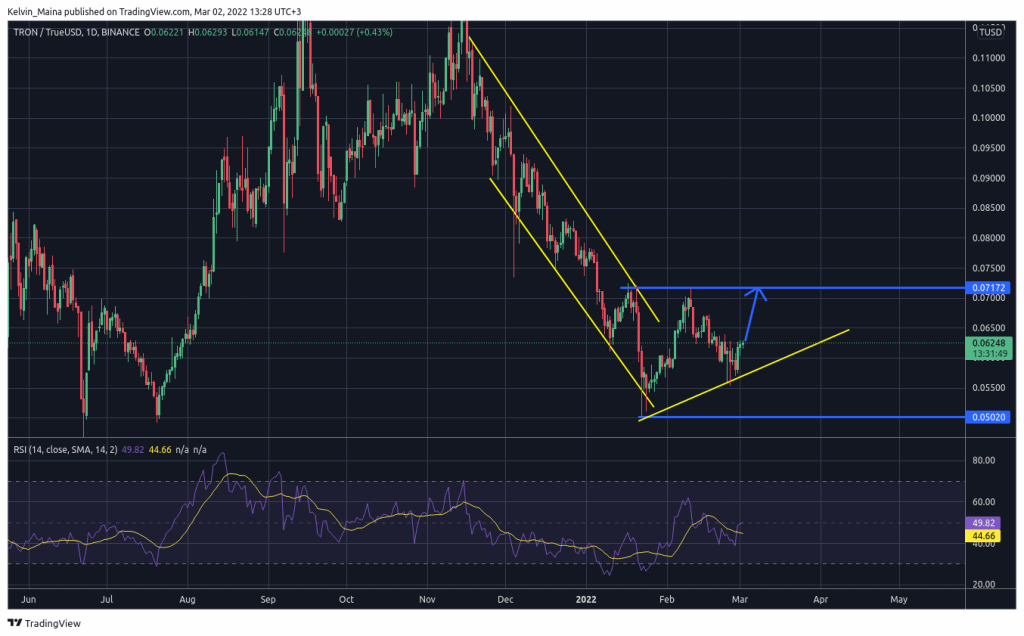
Tron prices have been relatively stable in today’s trading session, gaining less than one percent of their value. The Tron prices are also bouncing from a long-term bearish market, which has seen the Cryptocurrency lose more than 20 percent of its value since last month.
Looking at the daily chart, Tron prices are currently trading within the support and resistance structure and are also trading along the ascending trendline. The chart shows that the prices have already hit the resistance level of $0.07. However, the prices are unlikely to hit the support level of $0.05 and instead move upwards. This is because the prices have also been trading along the ascending trendline and will have to break to the downside to hit the support level.
However, the prices have failed to break the trendline and have instead bounced from it. Therefore, I expect the current bullish trend to continue until the prices hit $0.071 resistance level. However, if the prices break the trendline to the downside, then my trade will be invalidated. This will mean there is no trend reversal and the bearish move will continue.
Tron Daily Chart


