- Although the TRON price consolidates above the psychological big-figure, considerable overhead resistance caps the upside.
Although the TRON price consolidates above the psychological big-figure, considerable overhead resistance caps the upside. TRON (TRX) is trading at $0.102 (+2.5%), up around 13% in the last month and almost 300% year-to-date. TRON’s current market cap is $7.3 billion, making it the 29th most valuable crypto asset behind THETA (THETA).
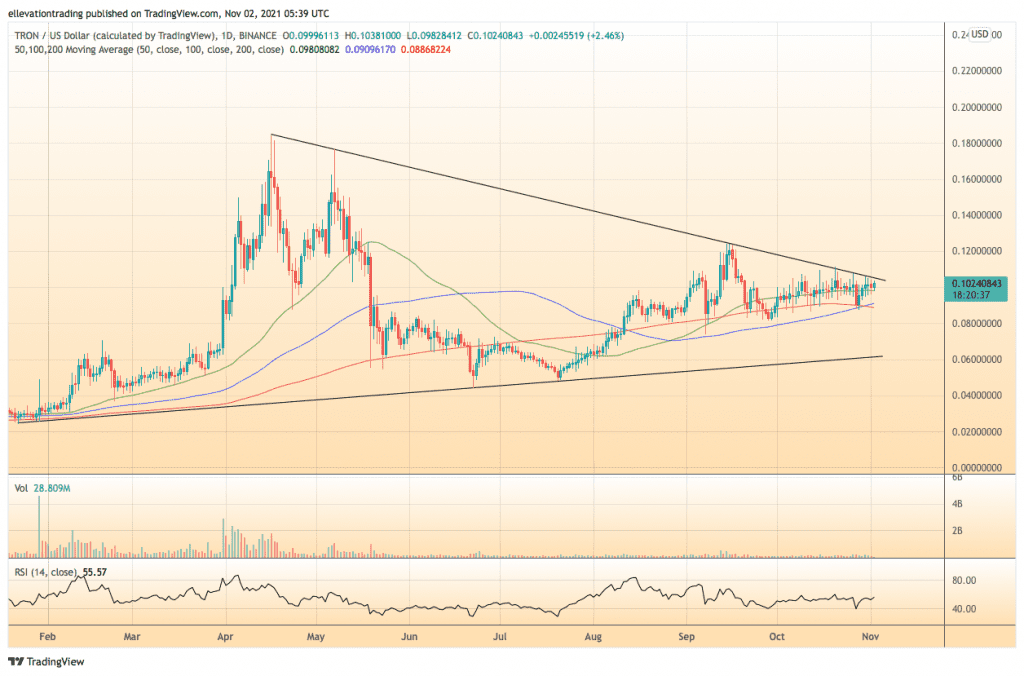
Despite Bitcoin and Ethereum tagging new highs recently, TRON has been unable to maintain an extended bullish rin. For most of the last two months, TRX has gyrated on either side of $0.100 in a broad but narrowing trading range. On a positive note, the TRON price is above the long-term moving averages, which is constructive. However, a descending trendline from May’s three-year high has so far put a lid on the price. The passive performance is maybe surprising considering TRON’s network growth. The total number of accounts on TRON has exceeded 59 million, and the Total Value Locked (TVL), a record $12.4. Considering the fundamental advances, it could force TRX to breakout to the upside soon. However, failure to do so could prove disastrous in the near term.
TRX Price Analysis
The daily chart shows trend line resistance at $0.1054. If the price clears the trend on a closing basis, a logical target is the September high at $0.124. Whereas, an extended rally could lift the price towards the 2021 high of $0.184. However, if TRX fails to hurdle resistance, a reveal towards the 100, and 200-Day Moving Averages at $0.909 and $0.886, respectively should follow.
Considering the overall buoyancy of cryptos, the bullish scenario carries more weight. Although until the trend is broken, it is the dominant thems. On that basis, I don’t see an opportunity at the current level. Traders should therefore let the technicals play out before jumping in. For that reason, my current stance is neutral, awaiting confirmation or a bullish breakout or bearish failure.
TRON Price Chart

For more market insights, follow Elliott on Twitter.


