- Summary:
- Inverted hammer candlestick patterns often appear in markets when new volatility comes in. Find out what causes them and what they tell us.
Table of Contents
The Inverted Hammer candlestick pattern is easily recognisable by its three primary features—a compact body and a long upper wick, resulting in an upside-down hammer shape. This pattern usually appears when the sellers run out of steam and as a downtrend comes to a close. Consequently, it signifies a bullish reversal.
Formation of the inverted hammer candlestick pattern
This pattern appears on an asset’s trading chart when buyers, or bulls, are taking control of the market and are driving up the asset’s price. It usually comes when sellers were driving down asset prices earlier, then buyers stepped in to inject fresh volatility in the market, and finally sellers pushed prices back up. This results in the formation of a candlestick where the top shadow looks like a hammer’s head, and the lower shadow looks like the handle, giving the impression of an inverted hammer.
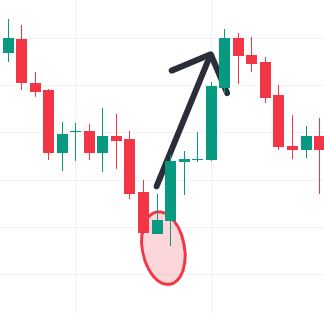
Inverted hammer pattern in a downtrend
When an Inverted Hammer forms after a lengthy downtrend, it signals that an uptrend is imminent, since the price decline was contained and remained close to the opening price. Essentially, it means that the prices rose, and the sellers quickly retreated, bringing them back down to opening levels.
When the hammer is inverted, it indicates that buyers are exerting pressure on the market. The pattern’s formation is an indicator that bears have run out of steam and bulls are getting ready to enter a market. The reliability of the signal is particularly strong when it appears around the bottom of a downtrend. In the aftermath of a downward trend, it signals a looming price reversal to the upside.
Inverted hammer in an uptrend
During a downturn, the inverted hammer’s lengthy upper shadow, tells us that the buyers are in control and are sending higher prices. The little real body near the lower end of the range shows us that there’s a developing equilibrium between buyers and sellers after a long bearish momentum, and the sellers are losing some control.
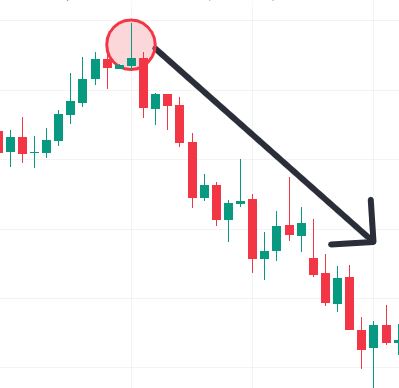
The Shooting Star is a bearish form of an inverted hammer pattern. The start of a downtrend is characterised by a lower price, followed by higher trading but, it closes near the opening price.
The Green Inverted Hammer
As a candlestick pattern, the green Inverted Hammer—sometimes called a Bullish Inverted Hammer—signals that the market trend is changing from bearish to bullish. Its direct opposite is the red inverted hammer.
Inverted Hammer vs Shooting Star
As highlighted above, the shooting star is not an inverted hammer. Despite their striking resemblance the two candles represent vastly different ideas. The inverted hammer signifies that the selling pressure is ending and it appears at the base of a downtrend, indicating that the price is about to assume an upward trajectory. On the other hand, the shooting star appears as the top of an uptrend as it comes to and end and indicates that a bearish trend is setting in.
In summary
Inverted hammer candlesticks are useful patterns in trading. However, a lot goes into impacting price movements, and these patterns are not in themselves supposed to be used alone. It is advisable to augment the trading strategy as a whole by considering fundamental influences in the market and using supplementary technical indicators and other trading tools.