- Summary:
- The Theta price has slumped over 20% from the early-October high and shows signs that further weakness may lie ahead.
The Theta price has slumped over 20% from the early-October high and shows signs that further weakness may lie ahead. Theta (THETA/USD) is slightly softer this morning at $5.927 (-0.09%), but up 17% in October and 217% year-to-date. However, the token is around 65% below the April all-time high of $16.61. Theta currently commands a market cap of $5.9 billion, ranking it the 34th most valuable cryptocurrency behind Fantom (FTM/USD).
Like many altcoins, Theta has failed to follow Bitcoin higher in the last two weeks. BTC is currently changing hands above $64,000 as yesterday’s ETF listing encourages capital to flow up the food chain. As a result, it appears that Bitcoin is sucking liquidity and money from the smaller names. Subsequently, BTC’s market share has increased to 47% and looks likely to grow more dominant in the near term.
Token Price Analysis
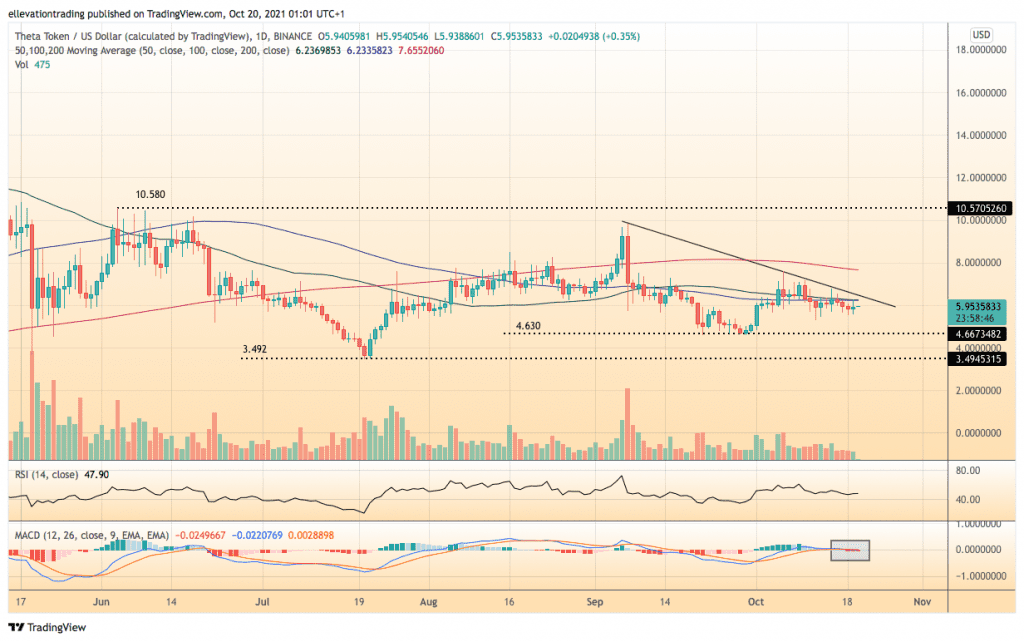
Several adverse developments have emerged on the daily chart. Firstly, the THETA price is trending lower, beneath the 50, 100 and 200-day moving averages (DMA’s). The 50 DMA at $6.235 and the 100 at $6.233 are the first resistance levels. Above the averages, a descending trend line at $6.436 adds to the confluent upside obstacles. Furthermore, the Moving Average Convergence Divergence Indicator (MACD) shows negative momentum is building. As a result, THETA is likely to return to the September low at $4.630, whereas a steeper decline would bring the July low at $3.492 into focus.
The deteriorating technicals should continue to weigh down THETA as long as it remains below the moving averages and the descending trend line. Therefore, a close above $6.436 invalidates the bearish view.
Theta Price Chart (Daily)

For more market insights, follow Elliott on Twitter.


