- Summary:
- Shiba Inu coin is down 3.64% in the last 24-hours, 15% in the previous week, and 50% below its all-time high.
Shiba Inu coin is down 3.64% in the last 24-hours, 15% in the previous week, and 50% below its all-time high. On Monday, Shiba Inu (SHIB) is trading at $00004457, valuing the project at $24.56 billion, making it the 12th-largest cryptocurrency behind Avalanche (AVAX).
Since the parabolic run to $0.00008870 in October, when it briefly flipped Dogecoin (DOGE), SHIB has been trending lower. Over the last two weeks, Shiba Inu’s market cap has dropped by more than $27 billion. Despite this, the coin, which has limited utility, is still one of the biggest cryptocurrencies. However, the coin is now at a critical juncture which could either slingshot the price higher or send it hurtling lower.
SHIB Price Analysis
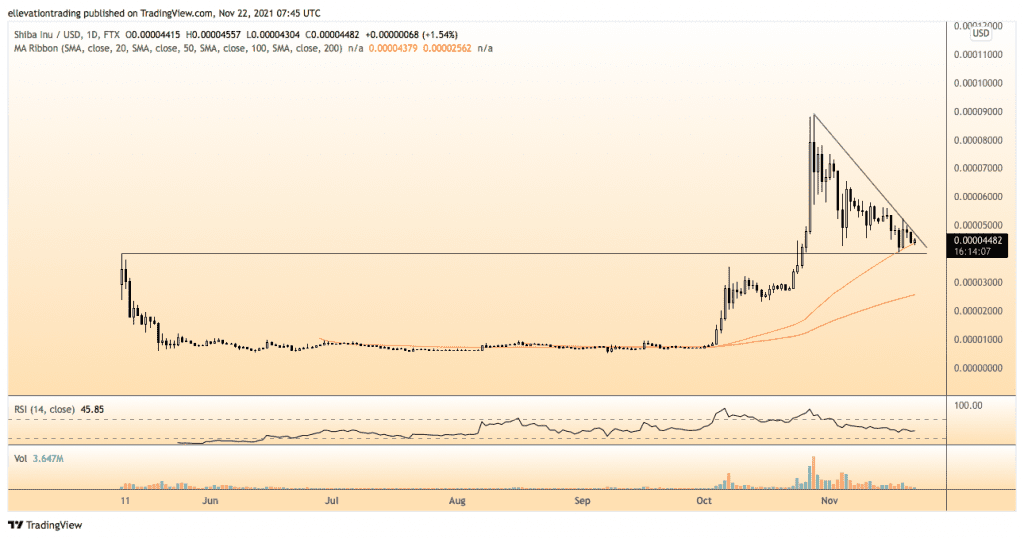
The daily chart shows the recent price action has formed a descending triangle formation. The trend line that makes up the bottom of the triangle aligns with the May high to provide support at $0.00004000. Above the market, a descending trend line from the All-time high caps the price at $0.00004688.
Until the Shiba Inu price breaks free from the triangle pattern, it’s hard to predict which direction it will take. However, successful clearance of the resistance could drive the price towards the mid-November highs around $0.00006000. On the flip side, a break below $0.000040000 could trigger a shape decline into the $0.00002300-$0.000030000 range.
In my opinion, the bearish scenario looks the likelier of the two. However, as long the price remains trapped in the triangle, either eventuality is possible. Therefore, my current view is neutral, awaiting confirmation of a breakout.
Shiba Inu Coin Price Chart (Daily)

For more market insights, follow Elliott on Twitter.


