- Summary:
- The Graph price is up by 3 per cent this week, following last week’s aggressive push to the downside that resulted in more than 30% drop.
The Graph price is up by 3 per cent this week, following last week’s aggressive push to the downside that resulted in the crypto losing more than 30 per cent of its value. Despite doing relatively well in the past two trading sessions, surging by over 15 per cent from Monday’s price low, today’s session is down by a percentage point.
Today’s session also points to a possibility that the Graph price may be resuming the aggressive bearish trend we saw last week following revelations that the FTX crypto exchange was in the verge of collapse. Part of the reason for the current price drop may be due to increased anxiety in the markets, with most investors fearing a repeat of last week.
There have also been multiple reports of FTX’s contagion throughout the industry, which has seen other firms, such as BlockFi, preparing to file for bankruptcy. In Japan, the largest cryptocurrency exchange, which was also owned by FTX, has already halted withdrawals, indicating last week’s debacle might not be over.
The greed and fear index also shows a reading of investors in extreme fear. The impact of such a reading is they might hesitate to invest in risky projects, especially cryptocurrencies, which may impact the industry’s liquidity and result in a stagnant market.
The Graph Price Forecast
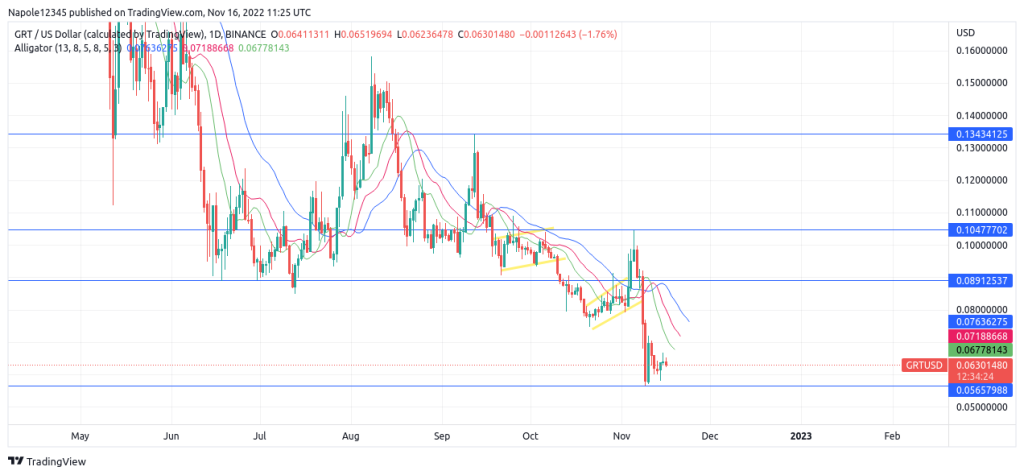
Following last week’s more than 30 per cent plunge in value, the past two trading sessions looked highly positive for the Graph price and its recovery chances. However, today’s trading session has shown there is still a likelihood that we might see the resumption of the recent bearish trend.
Therefore, based on the recent price action, I expect the prices to trade in a horizontal market, within narrow price ranges between the recent price low of $0.056 and the 0.089 resistance level. However, a trade below or above the price range will invalidate my sideways market analysis and signal the start of a new trend.
GRT Daily Chart


