- Summary:
- Despite US stockpiles falling for the fourth week in a row, oil prices continue to decline as concerns mount over China's economy.
Crude oil prices defied falling US inventory numbers to stare at the prospect of a third successive weekly decline. Benchmark Brent was down by 0.4 percent to trade at 82.06 per barrel, while West Texas Intermediate (WTI) traded at $78.04, having eased down by 0.3 percent at the time of writing. Despite an upbeat demand-side outlook in the United States, China’s economy has signaled potential turbulence ahead, triggering concerns over a possible decline in the overall demand.
The Energy Information Administration (EIA) reported a fourth-successive weekly decline in crude oil stockpiles on Wednesday, with the figures coming in at -3.74 million barrels, against the market forecast figure of -2.60 million barrels. However, China reported stagnation in its factory activity for the second month in a row in June, with the manufacturing PMI stuck at 49.5. This has led to the thinning expectations of increased demand in the summer. On the flipside, however, the United States reported a higher-than expected second quarter GDP growth of 2.8 percent against the consensus forecast of 2.0 percent, and that will provide support to oil price.
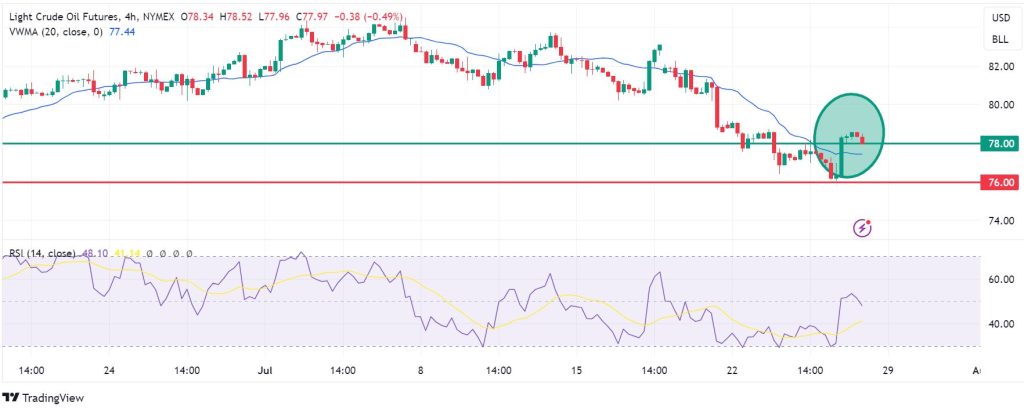
Momentum indicators
On the chart below, the price is above the Volume Weighted Moving Average (VWMA) line, signaling a bullish-leaning market. Note how a previous downward crossover of the price below the VWMA aligned with $78.00 and triggered a downtrend that was rejected at $76.00. Therefore, these two levels will likely serve as the pivot and support marks heading into the weekend. Meanwhile, the Relative Strength Index (RSI) was at 48, which is neutral-to-bearish. This signals a potential range-bound trading for the commodity in the absence of high-impact fundamental news.
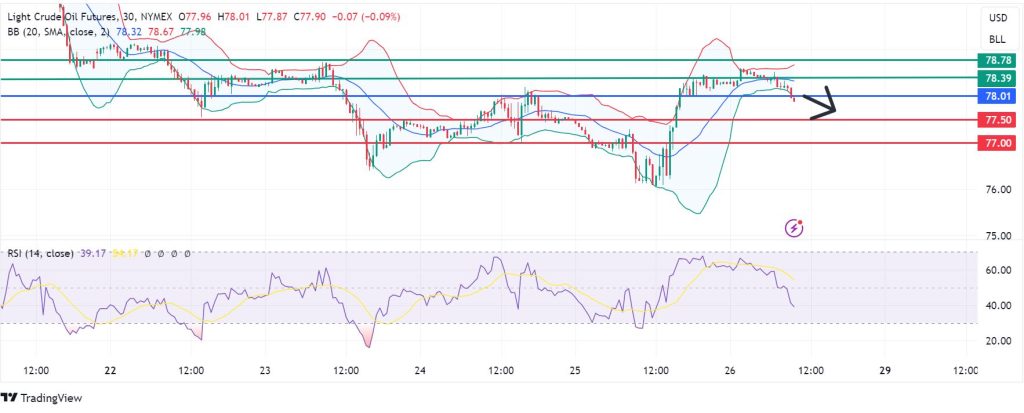
Near-term support and resistance levels
On the chart below, look for further downside if WTI price continues to face resistance at the $78.01 pivot mark. That could propel the sellers to take the price to the first support at $77.50, beyond which extended control could establish the second support at $77.00. However, a move above $78.01 will favour the buyers to take control. In that case, they could encounter the first resistance at $78.39. However, that barrier could be broken if the buyers extend their control, resulting in the invalidation of the downside narrative. Also, the upside momentum could push the price higher to test the next resistance at $78.78.