- Summary:
- The upward march of Bitcoin price is still limited by the descending trendling at $12,000, as pinbars and doji setup signal potential downside correction.
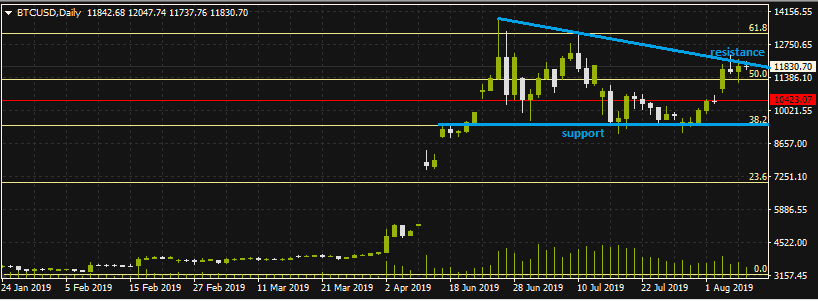
Bitcoin bulls continue to find it difficult to force prices above the $12,000 mark as the daily chart shows the formation of a potential doji on the descending trendline which extends from the June 26 high to the highs of the week. The shooting star formation of Tuesday was followed by a pinbar which bounced off the 50% Fibonacci retracement support level.
Trading volume continues to remain thin, and BTCUSD continues to be defined by the Fibonacci retracement which has its swing high at the November 2017 high and the swing low at the December 2018 low. The 50% Fibonacci line served as price support for Wednesday’s price action. Going forward, the 50% and 38.2% Fibonacci retracement levels continue to remain relevant areas of medium-term support. Upside remains limited by descending trendline.
The candlesticks of the last three days indicate possible exhaustion of buying activity at current levels, barring any news releases that may influence price activity. If the expected downside plays out, then the 50% Fibonacci level (11,300) may act as initial support, with the 38.2% Fibonacci level at 9,480 next in line.
If price breaks above the trendline resistance, 13,190 (61.8% Fibonacci retracement) will be the next medium-term resistance.


