Stellar price is in trouble. After rallying by more than 231% this year, the XLM/USD price has dropped by more than 31% in the past 24 hours. This has brought its total market cap to more than $6 billion, making it the 9th biggest cryptocurrency in the world.
What happened: Stellar and other digital currencies soared yesterday as demand and optimism continued to rise. At some point, the price of Bitcoin reached $40,200, which is remarkable considering that it was below $4,000 last year. Ethereum price also soared but then pulled back.
However, shortly afterward, the price reversed to $38,000, pulling other altcoins with it. This price action was mostly because many traders rushed for the exit once the price reached $40,000.
Stellar price daily chart analysis
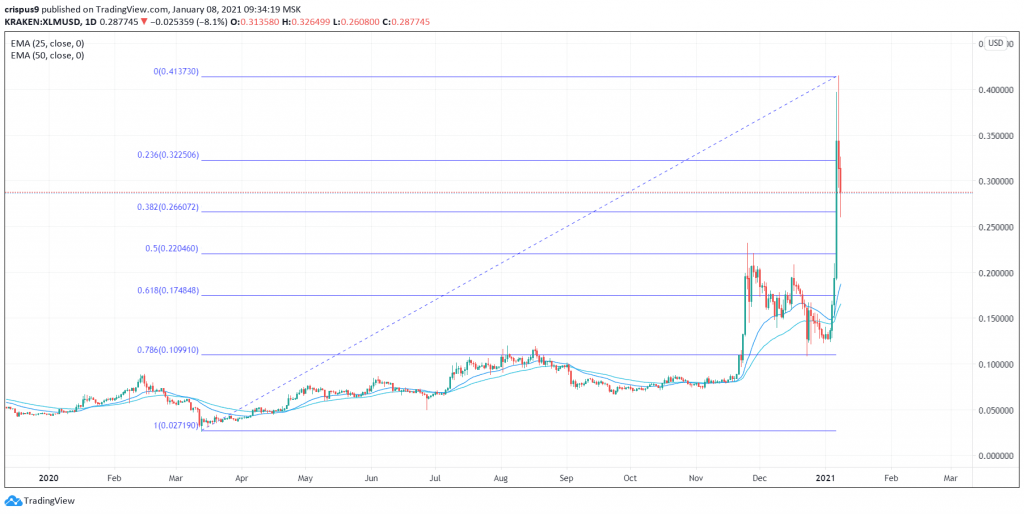
So, what next for Stellar price: On the daily chart, we see that Stellar price dropped to the 38.2% Fibonacci retracement level yesterday. Today, it has bounced back and is approaching the 23.6% retracement level.
The price remains above the 25-day and 50-day moving averages. Therefore, the outlook on the daily chart is relatively neutral. If it moves above the 23.6% fib level at $0.3223, it will mean that there are more bulls in the market. This could see it retesting its all-time high of $0.4150.

XLM/USD 1-hour analysis
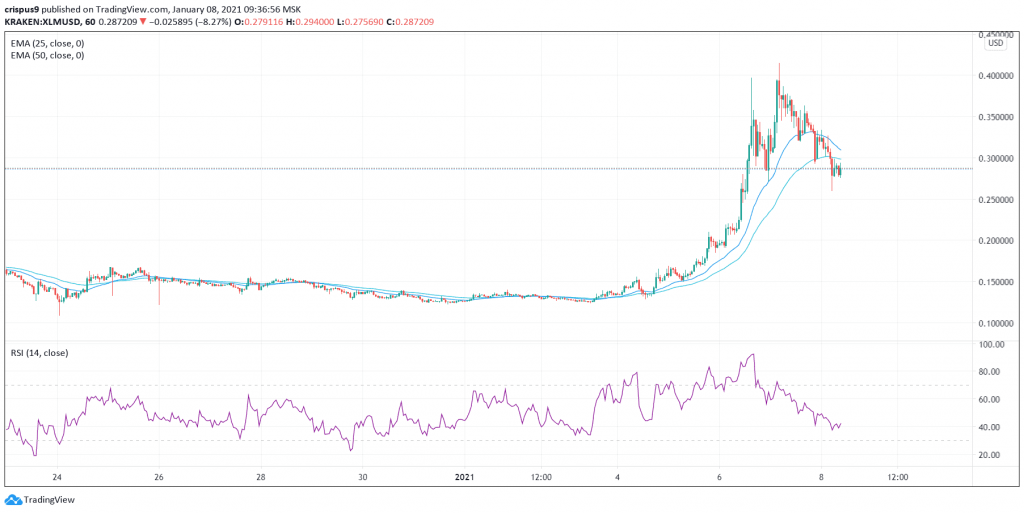
Turning to the hourly chart, we see that Stellar price has been in a downward trend. In it, it has moved below the 25-day and 50-day EMAs while the RSI has continued to drop. It is now slightly above the oversold level of 30. Therefore, the pair is likely to continue falling as bears target the next support at $0.25.
XLM technical chart


