- Summary:
- Despite bouncing from last week's low, the Stellar price action is weak, which could be setting XLM up for a substantial decline soon.
Despite bouncing from last week’s low, the Stellar price action is weak, which could be setting XLM up for a substantial decline soon. Stellar Lumens (XLM/USD) got off to a great start in September, gaining over 30% in the first week and climbing above the 200-day moving average. However, last Tuesday, the impressive run of form came screeching to a halt.
Bitcoin’s (BTC/USD) sudden 20% drop sparked mass liquidations across the cryptocurrency market, and XLM was one of the hardest hit. At its lowest point on Tuesday, the Stellar price was almost 60% below Monday’s high before rebounding to finish the day -20% lower at $0.3357. However, although XLM has inched higher from last week’s $0.2755 low, the price action is not encouraging.
XLM Price forecast
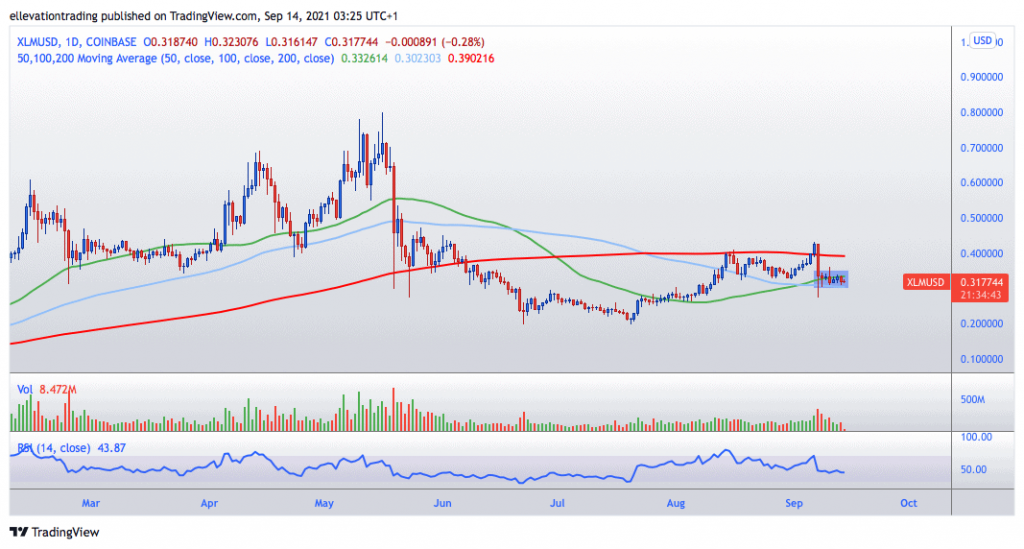
The daily chart shows the current XLM price of $0.3175 is sandwiched between the 50, and 100-day moving averages. The 50 DMA at $0.3326 is the first resistance line and has successfully capped the price ver the last three days. Below the market, the 100 DMA offers the first significant support level at $0.3032.
Notably, the trading activity had been trailing off following Tuesday’s high volume sell-off. The drop in volume indicates that buyers are not stepping in to take advantage of the discount. This will likely result in the price drifting below the 100 DMA, triggering a drop to the July lows, around $0.2000.
However, this bearish view is based on not just Stellar but the cryptocurrency market as a whole. And if Bitcoin and Ethereum (ETH/USD) stage strong recoveries, the Stellar price will likely follow suit. Although I favour the downside, my bearish view becomes invalid if XLM trades above the 200 DMA.
Stellar Price Chart (Daily)

For more market insights, follow Elliott on Twitter.


