- Summary:
- Today's trading session has seen Stellar Lumens' price dropping. This brings to an end the latest bullish move from the previous two days.
Today’s trading session has seen Stellar Lumens’ price dropping. This brings to an end the latest bullish move that had seen the previous two trading sessions closing above their opening prices. Stellar Lumens seems to be getting endorsements from people of all walks of life on the fundamental side of things.
This includes James Brumley, a Nasdaq columnist who wrote that, even with his scepticism of the cryptocurrency market, Stellar Lumen made sense to him. He argued that the real-world application of the Stellar Lumens is what made him look at the cryptocurrency in a different light.
Stellar Lumens Price Prediction
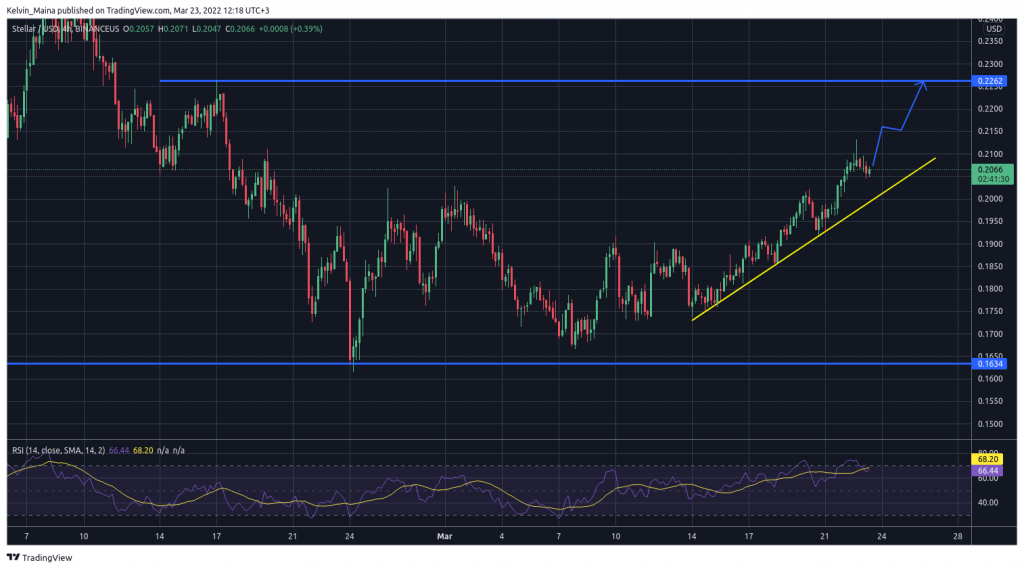
Stellar Lumen price has been on the rise for weeks. The current bullish move started on March 8, 2022, after the cryptocurrency failed to hit the support level of $0.16 and instead reversed the trend. However, in today’s trading session, the cryptocurrency has shown weakened signs of a bullish move. The crypto also records a drop in price of less than a percentage point.
In the 4-hour Stellar Lumen chart below, we can see that the prices have been trading along an ascending trend line for more than ten days. We can also see that today’s trading session started with Stellar Lumen’s price dropping. However, the recent candlesticks show that Stellar Lumen’s price may be recovering, showing signs that the bullish move is still not over. Furthermore, the chart shows the cryptocurrency has been trading within the support and resistance levels of $0.16 and $0.22, respectively, for a very long time.
Therefore, my Stellar Lumen price prediction shows that the prices are likely to hit the $0.22 resistance levels in the coming days. This analysis is based on the fact that the crypto is bouncing off of the support level, and is currently on a strong bullish move. The analysis is also based on the recent price action that has seen Stellar Lumen trade along ascending trend line for more than a week.
Stellar Lumen 4-hour chart


