- Summary:
- The Stellar Lumens price prediction indicates the potential for a limited upside in the near term, after its Robinhood listing.
Bullish Stellar Lumens price predictions are gradually creeping into the market after the XLM/USDT pair inched 1.05% higher this Friday. Today’s uptick has been mostly fueled by the negative response of the USD-linked Tether token to the dismal Non-Farm Payrolls report, which has tapered bets of a 75 bps rate hike by the Fed. This market scenario has promoted a mild uptick in several tokens, including Stellar Lumens.
Before today’s upside move, the XLM/USDT had made two days of soft gains following the announcement by Robinhood that it was adding Stellar Lumens and Avalanche to its list of tradable tokens. Following this news which hit the newswires on Monday, bullish Stellar Lumens price predictions began to filter through, sending the token up 3.41% for the week.
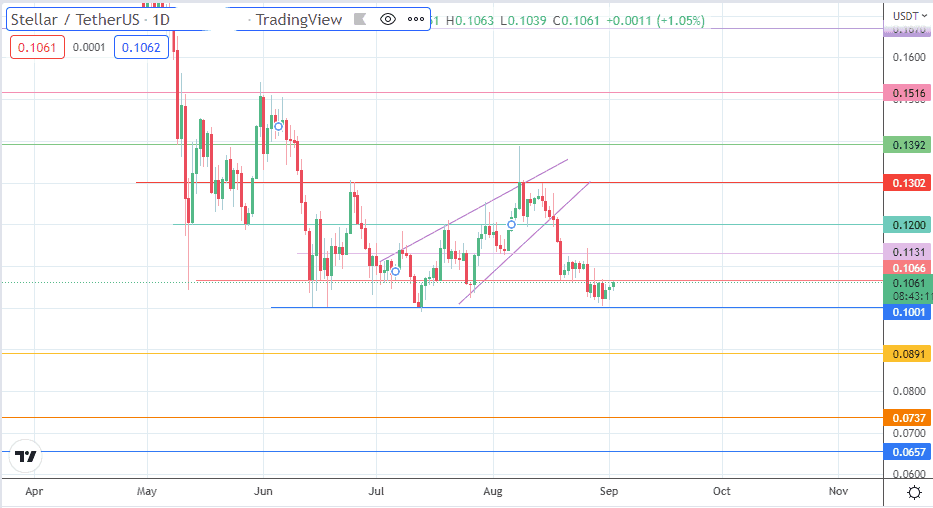
From a technical analysis standpoint, the price action is trading within a range formed by 0.1001 (floor) and 0.1066 (ceiling). The direction of price action will depend on the resolution of this range.
Stellar Lumens Price Prediction
The XLM/USDT pair has found support at the 0.1001 price mark, which has held firm as support since it was tested on 14 June, 18 June and 13 July 2022. The bounce needs to clear the resistance at 0.1066 (22 August low and 30 August high) to give the bulls access to the 0.1131 barrier, where the 10 July high/4 August low points are found. 0.1200 presents itself as the next target if the advance continues, leaving the 24 June and 9 August highs at 0.1302 as the next milestone if there is no opposition from the bears.
On the other hand, rejection at 0.1066 brings 0.1001 into the mix for a retest. If this support fails to hold this time, a descent toward 0.0891 comes into the mix, being the site of the 9 November 2019 high/6 February 2020 highs. There are additional harvest points for the bulls at 0.0737 (13 June 2020 high/5 November 2020 low) and at 0.0657 (6 July 2020 low).
XLM/USDT: Daily Chart


