S&P 500
The S&P500 was higher yesterday as the U.S. economy got a boost from ISM Manufacturing data and the move caps an 18.5% rise from the end of June. The next big data release for the economy is Friday’s Non-Farm Payrolls (NFP) data and traders will be watching today’s ADP employment figures, as well as tomorrow’s jobless claims to get some confirmation that the data can meet analyst expectations.
The ADP employment change release will be a big test for the U.S. economy as the market is expecting to see almost a million jobs added, up from 167k in July. If the market matches this number or beats it, we could see a rally higher in stocks.
The actual picture is not as clear cut, with tomorrow’s initial jobless claims, which are new claims, expected to be around 950k. The number of contuing unemployment cases is also sitting at 14 million. The unemployment rate in the United States surged from 4.4% in March to 14.7% in April. The number has steadily declined to 10.2%, but there is still work to be done. The NFP number on Friday is expected to drop to 9.8% and the data over the next two days should help traders to decide if this is likely before the Friday release.
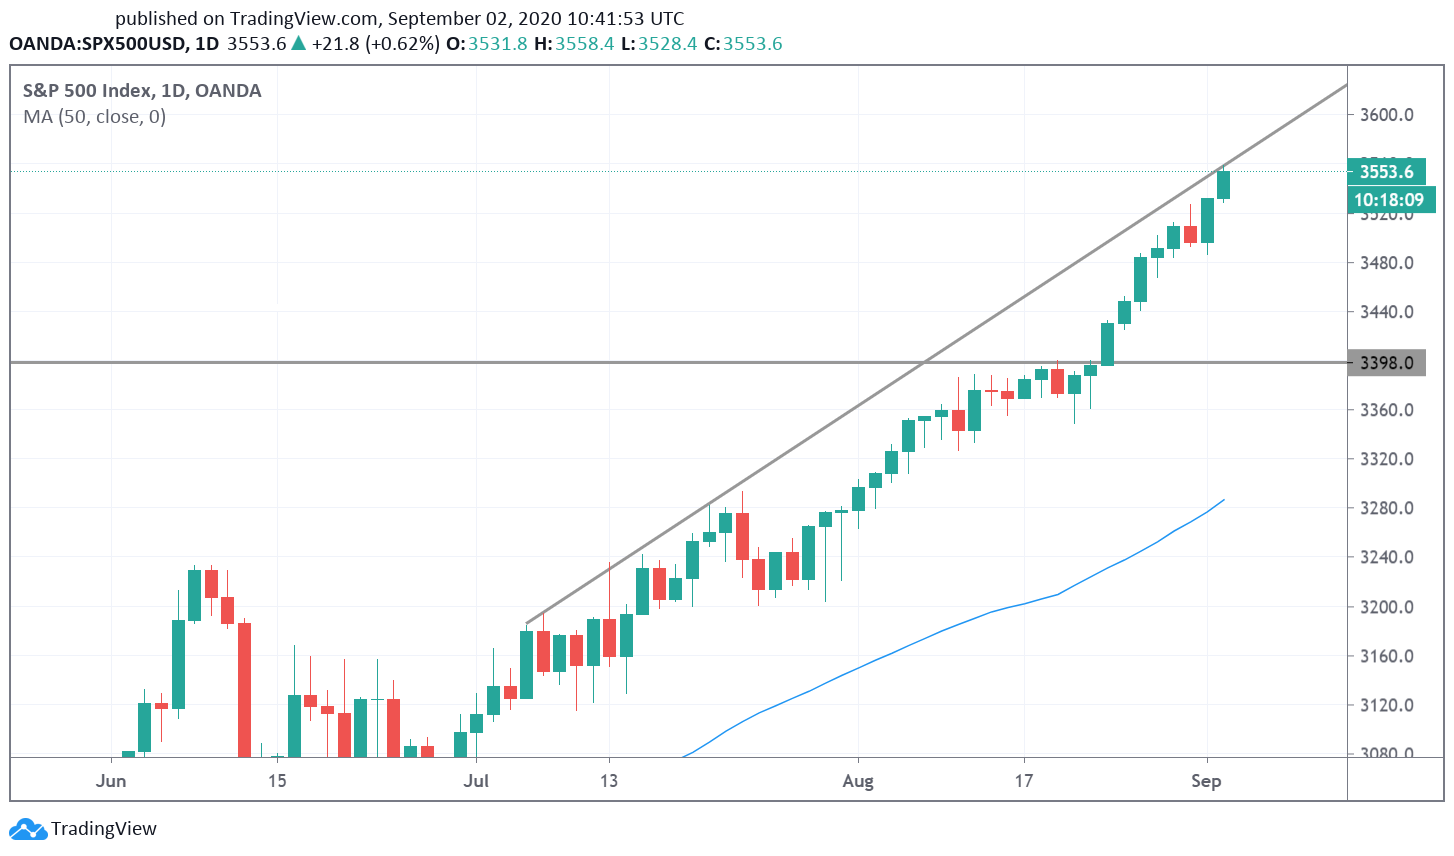
The S&P500 index rallied to new all-time highs above the 3398 level, which was the high on February 20th ahead of the coronavirus sell-off. The recent rally from July is creating a rising resistance line and this is now being tested. The rally in stocks is strong enough to take this level out, but traders should wait for employment figures to determine whether the index can stay above there for now. The 3398 breakout level would be the first resistance that the market would want to target and support there would be a buy signal. The further these indices go, the higher the chance of a deep pullback.