Nasdaq
The S&P 500 index rallied on Monday following two weeks of losses, as several positive news boosted investor sentiment. Top of the list is the news that Oracle is now the primary candidate to take over ByteDance’s TikTok operations in the US. This news sent Oracle shares higher by nearly 5%.
More merger news also provided a fillip to the S&P 500 index, as chipmaker Nvidia is set to buy Arm, a UK-based chip designer for an estimated $40 billion mega-deal. The M &A bug has also caught Verizon in its fangs, as the company plans a $7billion stock + cash purchase of prepaid wireless reseller Tracfone from Mexican company America Movil SAB. This deal gives Verizon access to America Movil’s 21 million prepaid customers in the US.
Presently, the S&P 500 index is up 1.62% at 3395.1 as at the time of writing, buoyed by the tech subsectors. The strong performance of the tech index is overriding negative performance by the energy index, which has been hit by OPEC’s lower projections on crude oil demand this Monday.
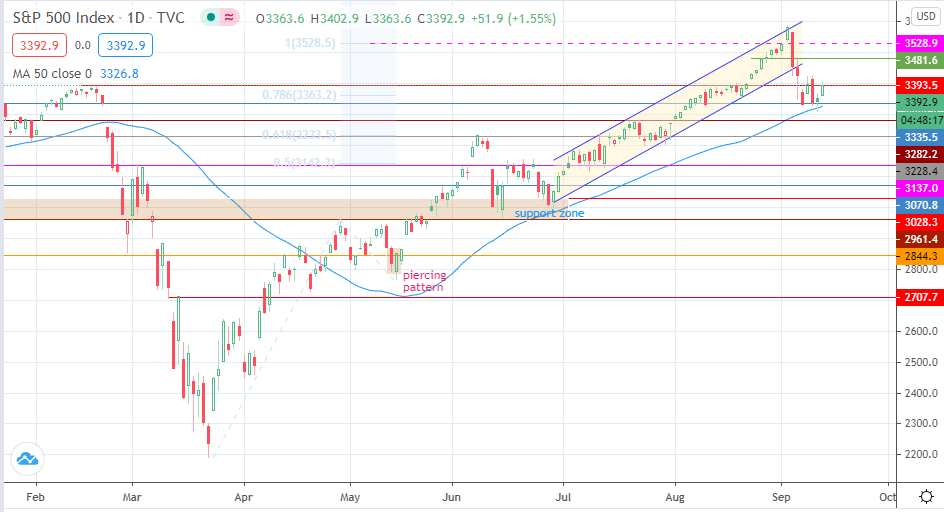
The bounce on Friday and today’s follow-through buying comes off the 3335.5 support level, anchored by the 50-day moving average. However, today’s move has hit resistance at 3393.5. Price needs to overcome this resistance to target the 3481.6 resistance. Above this level, 3528.9 stands as the only barrier to the S&P 500 re-establishing new record highs.
Conversely, a retreat from the present barrier at 3393.5 brings 3335.5 back into focus as the immediate support. It requires a breakdown of this level to enable 3282.2 and 3228.4 become the next downside targets. 3137.0 and 3070.8 are also lining up as additional targets to the south, but need a significant selloff to come into view.