- Summary:
- The S&P 500 index futures tilted upwards on Thursday as investors refocus on the upcoming Jackson Hole Symposium.
The S&P 500 index futures tilted upwards on Thursday as investors refocus on the upcoming Jackson Hole Symposium. It also reacted to the relatively mixed earnings by companies like Salesforce and Autodesk. It rose to $4,160, which was slightly above the lowest point this week. The fear and greed index has moved from last week’s greed level to 46.
Fear and greed index retreats
The S&P 500 index pulled back this week as investors focused on the strong US dollar. The dollar index jumped to the year-to-date high of $109.3 after the relatively hawkish Fed minutes that were published last week. These minutes showed that the bank will likely continue hiking interest rates in the coming months in a bid to battle the soaring inflation.
The next key catalyst for the index will be the upcoming Jackson Hole Summit in Wyoming. Historically, Fed officials have used the meeting to reset expectations about the next moves about monetary policy. For one, it will be Jerome Powell’s first speech after the US published improving inflation data.
The S&P 500 has also reacted to the rebounding prices of crude oil. Prices jumped this week after some OPEC members, including Saudi Arabia, warned that they could slash production in a bid to boost prices. Most members of the cartel have done substantially well as prices have remained above $100.
Meanwhile, some companies in the index published mixed results. For example, Salesforce stock price declined after the company trimmed its forward guidance for earnings and revenue. The firm announced a $10 billion share buyback program. Similarly, Zoom Video also downgraded its expectations as demand waned.
S&P 500 index forecast
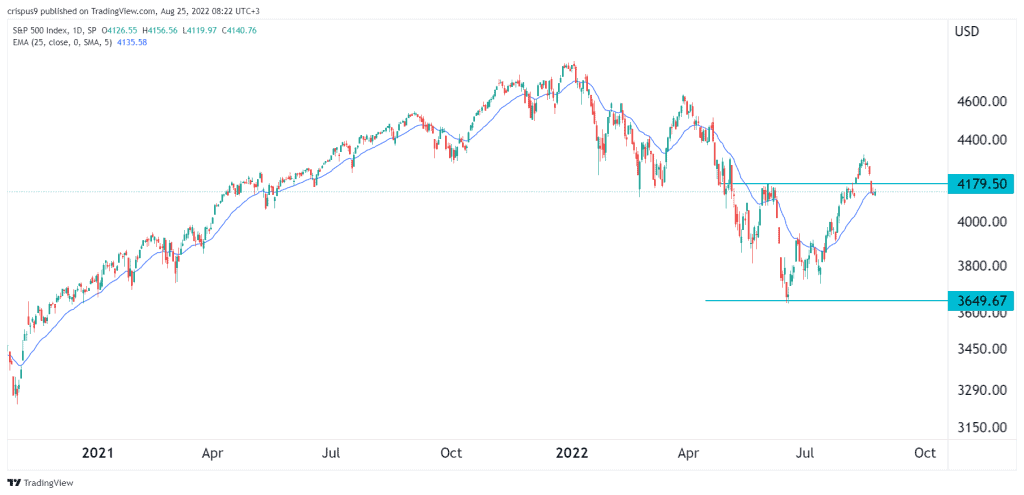
The daily chart shows that the S&P 500 index has been in a strong bullish trend in the past few weeks. It managed to move from a low of $3,650 to a high of $4,325. This recovery faded this week as the index moved below the important support at $4,180. This is part of a break and retest pattern. It is also slightly above the 50-day moving average.
Therefore, the index will likely resume the bullish trend and rise to the next resistance at $4,325, which was the highest point on August 17. A drop below the support at $4,000 will invalidate the bullish view.


