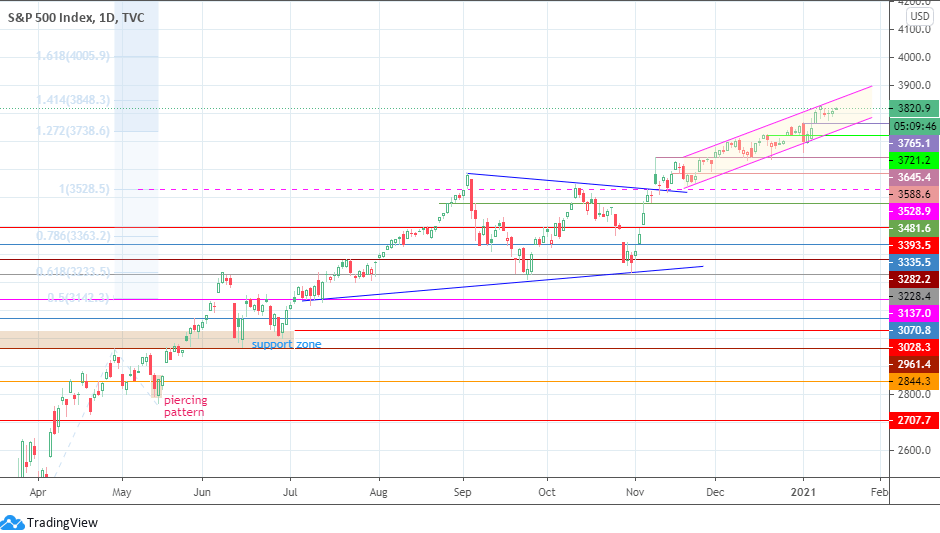
- The S&P 500 index is pushing towards new highs above 3850, and this could be actualized if Joe Biden unveils a new stimulus package.
Expectations of an enhanced stimulus package by incoming US President Joe Biden enabled US markets to get off to a bullish open on Thursday, but for the S&P 500, the open was a muted one. This is because of a surge in the initial jobless claims data for the week ended January 9, ending at 4-month highs for this jobs metric.
Initial jobless claims surged to 945K, which outstripped the consensus number of 784K and the previous number of 784K, as the surge in coronavirus cases took its toll once more and increased the number of people applying for unemployment benefits for the first time ever. The 4-week average also rose by 18,250, with continuing jobless claims also climbing from 5.07 million to 5.27 million.
However, the dour jobless claims numbers were overcome due to strong risk plays on stocks linked to risky assets. The energy stocks surged more than 1%, making this class of stocks the top-performing index on the S&P 500 this Thursday.
Technical Levels to Watch
The upside move of the S&P 500 after the break from the symmetrical triangle on the daily chart has been defined by the ascending channel. Price is now aiming for the channel’s upper border, which would take it to a new record high somewhere around the 3848.3 price level (141.4% Fibonacci extension level). Above the channel. The 161.8% Fibonacci extension point at 4005.9 could be the next target for record-seeking buyers.
Conversely, a rejection at the channel’s return line could open the door towards a retest of 3765.1, where the channel’s trend line lies. Below this level, 3721.2 lies in wait; a target that could be actualized following the channel’s breakdown. 3645.4 and 3588.1 are the next downside targets, as is 3528.9.
S&P 500 Daily Chart


