- Summary:
- The S&P 500 index has risen to new highs after the October jobs report showed a vast improvement in the US Labor market.
- NFP for October beats estimates as US Labor market recovers
- Unemployment rate drops from 4.8% to 4.6%
- S&P 500 Index rises for 7th straight day to touch new highs at 4715.
The S&P 500 index has hit new record highs after the upbeat jobs report of October and the dropping of long-term bond yields as a result of the BoE’s unexpected dovish action on Thursday.
The October Non-farm Payrolls report showed that the US added 531K jobs, improving September’s upward revision of 312K jobs. It also beat estimates, which had put forward an expectation of the addition of 455K jobs. The unemployment rate also surprised the markets, dropping from 4.8% to 4.6% (versus consensus of 4.7%).
Falling long-term bond yields are also driving renewed interest in stocks listed in the US markets. After the Bank of England opted not to hike rates in Thursday’s MPC meeting, bond yields in the UK, Europe, Asia and the US nosedived. The US long term bond yields have fallen nearly 7% since Thursday.
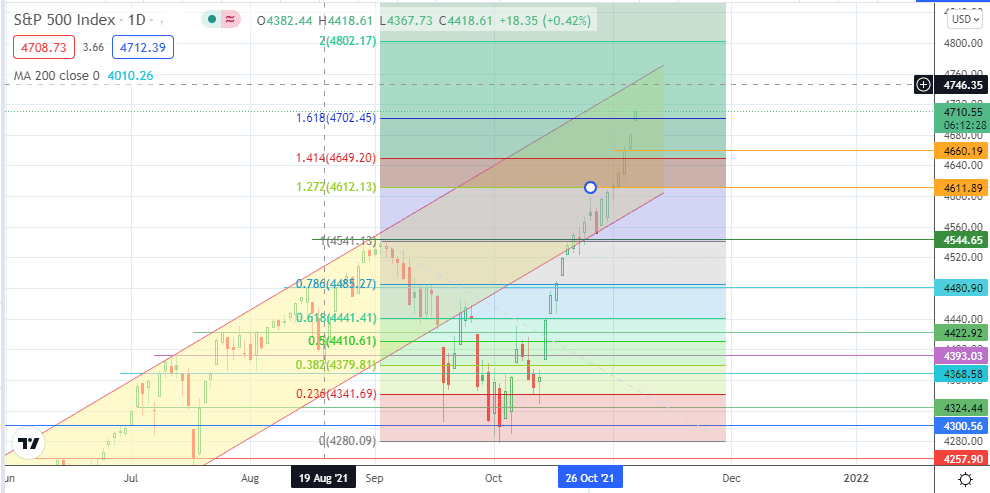
The S&P 500 index is up 0.68% on the day, hitting new highs at 4715.25.
S&P 500 Index Outlook
The active daily candle has violated the resistance at the 161.8% Fibonacci extension from the swing of 2 September to 4 October. A sustained break of this level opens the door to possible new targets at 4802.17 in the near term. There is also the potential for a pitstop at 4760.00, where the channel’s upper border intersects the horizontal price level.
On the other hand, failure to break above the 4702.45 price mark could allow for a corrective decline, which targets 4660.19 initially (3 November high/4 November low). If this level fails to stop the correction, 4612.13 (127.2% Fibonacci extension) becomes the next available target. 4544.65 and 4480.90 are additional targets to the south.
S&P 500 Index: Daily Chart

Follow Eno on Twitter.


