- Summary:
- The S&P 500 rallied for three straight days as investors cheered the latest retail earnings by companies like Walmart and Home Depot.
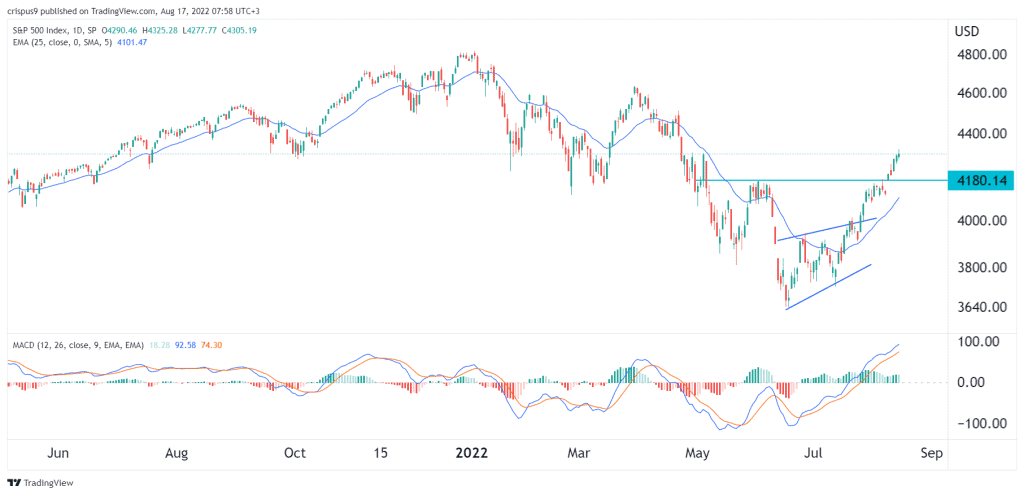
The S&P 500 rallied for three straight days as investors cheered the latest retail earnings by companies like Walmart and Home Depot. It also rose as the fear and greed index surged to the greed zone for the first time in months. It is trading at $4,305, which was the highest level since April 22nd of this year. The price is about 18.4% above the lowest level this year, meaning that it is approaching a bull market.
Fear and greed index rises
The fear and greed index is a closely watched tool that was developed by CNN Money to track several small indices. The index watches the performance of key data like the VIX, safe-haven demand, and stock price breadth and strength. In the past few weeks, the index has rallied to the greed level of 57, signaling that investors are getting enthusiastic about the market.
This strength continued this week after Walmart and Home Depot published strong quarterly results. The two firms surprised the market because they had warned about the state of their businesses recently. Other retail stocks to watch this week are Lowe’s, Target, and Kohls among others. In addition, other S&P 500 constituent companies like Analog Devices, TJX, Krispy Kreme, and BJ’s Wholesale will publish their results.
The S&P 500 index will also react to the latest minutes by the Federal Reserve. These minutes will provide more information about what to expect in the coming months. Analysts expect that the bank will hike interest rates by 0.50% in September followed by two 0.25% in the final two meetings of the month.
S&P 500 forecast
The daily chart shows that the S&P 500 index has been in a strong bullish trend in the past few weeks. Along the way, the index has managed to rise above the important resistance level at $4,180, which was the highest point in June. It has moved above the 25-day and 50-day moving averages while the MACD has continued rising.
Therefore, the index will likely continue rising as bulls target the next key resistance point at $4,500. A drop below the support at $4,180 will invalidate the bullish view.


