- Summary:
- Silver continues to trade sideways for the day in its pairing with the US Dollar. However, watch this level for hints of the downtrend resuming.
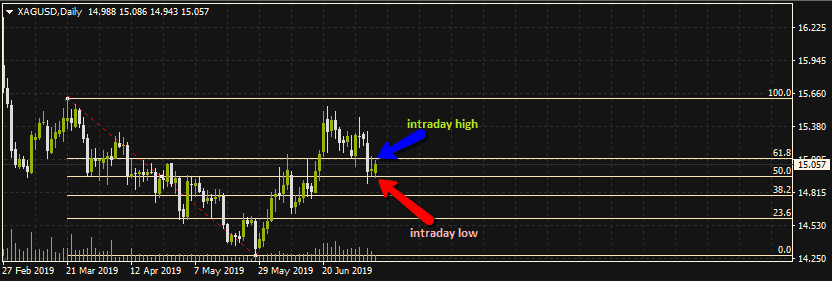
Silver continues to trade sideways for the day in its pairing with the US Dollar. A look at the XAG/USD pairing will show that within the context of the daily pivot points, the intraday range has been between $14.943 to the downside (which is where the S1 pivot point is located) and $15.086 to the upside (close to the R1 pivot). These areas correspond to the 50% and 61% Fibonacci retracement levels drawn on the daily chart from the swing high of March 21 to the swing low of May 29.
XAG/USD Daily Chart
The XAG/USD pair is presently trading at $15.032, with the RSI signal line testing its previous key levels. The pair is expected to remain in consolidation for the day, as long as the key support of $14.94 and the key resistance of $15.08 hold firm.
If the price is able to close above the key support area, then $15.19 and $15.26 and $15.50 will come into focus as targets for the week.
On the flip side, if price resumes the long term downtrend by breaching the $14.94 support area, this will pave the way for a test of the lower support levels seen at $14.87, $14.78 and $14.50 respectively.


