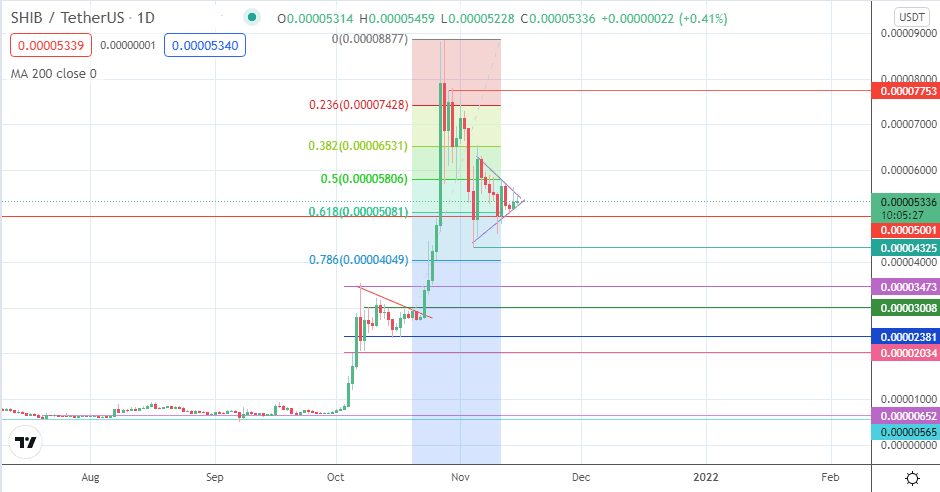
- The Shiba Inu price predictions will rely on the outcome of the symmetrical triangle on the daily chart to determine future price moves.
There are more Shiba Inu price predictions to the upside, given what has been happening with the token in the last few days and initial price action on Monday. SHIB wales were said to have bought billions of tokens, with the average purchase amount for each whale totalling $1million, according to a report by U.Today on 12 November.
Shiba Inu was listed on Coinbase for US residents on 5 November, while the coin is also set for listing on India’s CoinDCX app. This is the second listing for Shiba Inu on an Indian exchange, the first being on Zebpay. Following a 62% decline on the SHIB/USDT pair, the price is starting to see some upside price action. The pair is up 0.66% this Monday as of writing.
Shiba Inu Price Prediction
The daily chart reveals price consolidating into a symmetrical triangle, following the bounce on the 61.8% Fibonacci retracement level at 0.00005001. Traders would be looking to see the direction of the break from the triangle. A break of the triangle to the upside signals an end to the retracement. This move would target completing the measured move from the triangle at 0.00007753 (29/30 October highs). This move would need to remove the 0.00005806 and 0.00006531 resistance barriers (31 October low and 5 November high, respectively).
On the flip side, a breakdown of the triangle continues the retracement, targeting the 4 November low at 0.00004325. If the decline continues, we could see other pivots at 0.00003473 and 0.00003008 in that sequence.
Shiba Inu: Daily Chart

Follow Eno on Twitter.


