- Summary:
- Shiba Inu price has struggled to break above $0.0000190 for the last week. Heres's the way out of a potential bearish momentum.
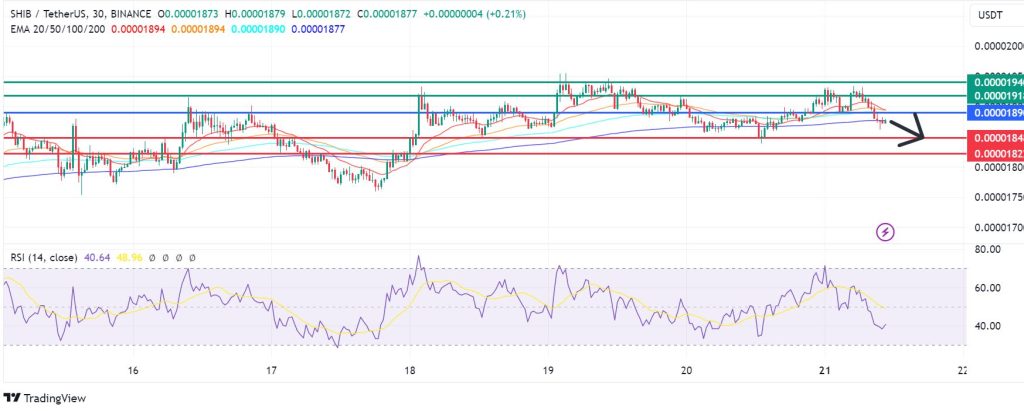
Shiba Inu price struggles continued on Monday as it declined by 1.5 percent to trade at $0.0000187 at the time of writing. After multiple attempts in the past week, the meme coin has been rejected near the psychological resistance area of $0.0000190. Therefore, a decisive break past that mark could potentially strengthen the upside for further gains.
Despite its recent struggles at the psychological barrier, SHIBUSD has gained more than 6 percent in the last week. In addition, the current price is above the 20 and 50 Exponential Moving Average (EMA) levels. This signifies an underlying bullish momentum that could provide support and minimise near-term declines.
A lot will depend on the performance of the crypto market bellwether, Bitcoin’s ability to break into the $70k territory. That could create a positive sentiment in the market to help push Shiba Inu price past the psychological resistance at $0.0000190. On the downside,however, SHIB price will also be under pressure from Dogecoin.
Dogecoin’s performance has spiked in the last week, gaining 37 percent on positive sentimental momentum. This has seen it become as the best performer among the top 15 crypto assets during that period. Therefore DOGE currently offers a better proposition than Shiba Inu, which could weigh down on the latter among meme coin enthusiasts.
Shiba Inu price
The RSI indicator on Shiba Inu price signals that the sellers are currently in control. The decline will likely persist if resistance continues to be at 0.0000189. The downside will likely find initial support at 0.0000184, but a stronger downward momentum could break below that level to test 0.0000182.
On the other hand, a move above 0.0000189 will signal the onset of bullish control. In that case, the first resistance will likely be at 0.0000191. However, an extended control by the buyers could break above that mark and render the downside narrative invalid. Meanwhile, the upside could extend to encouter the next resistance at 0.0000194.


