

What are the IREDA share price forecasts for 2026? The Indian Renewable Energy Development Agency (IREDA) share price is currently trading at ₹127-₹129 Rupees as of Feb 2026. The stock has traded within the ₹121.65- ₹187.70 range within the last 52 weeks. This sets up the IREDA share price to fit the narrative of a stock base-building below previous highs.
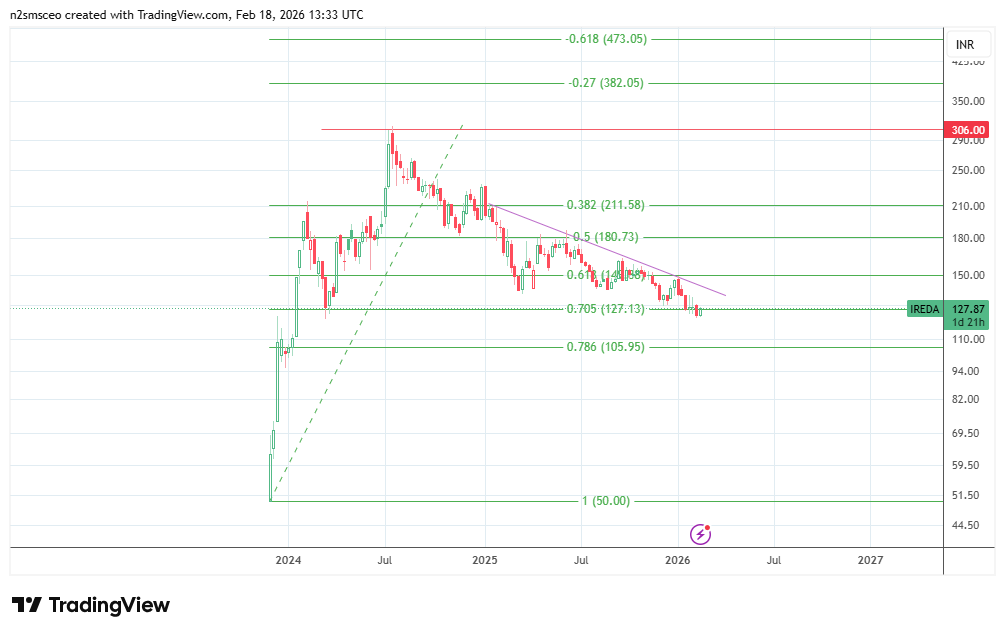
IREDA Share Price Live Chart
Where is IREDA right now? The IREDA share price recently hit a 52-week low amid mounting bearish sentiment. Despite a bounce this week, the stock remains near the lower end of its 52-week range. The current levels of the IREDA share price indicate that investors are no longer driven solely by the “going green” renewables theme of 2021-2024, but are now interested in the quality of the company’s assets and its funding channels, as these affect the stock’s growth quality.
IREDA Share Price Forecasts for 2026: Macro Drivers
The macro drivers for the IREDA share price forecasts for 2026 are as follows:
- Growth of the loan book and execution
- Earnings quality
- Funding/capital stack
- Asset quality
1. Loan Book Growth and Execution
One of the major drivers of IREDA’s share price is the growth of its loan book and the impact of sanctions. The loan book rose to 84,445 crore Rupees, a 31% jump when compared to the previous year. The company’s H1 provisional loan sanctions update saw a 86% YoY increase to 33,148 Rupees. Earnings visibility is expected to improve if disbursements continue at this fast pace.
2. Earnings Quality
The company’s first-quarter press release for the 2026 fiscal year reported a 49% YoY increase in operating profits and a 30% rise in total operating income. However, profits after tax fell YoY. The company’s ability to stabilize credit costs, which led to a decline in Q1 FY2026 PAT, will be a key driver of the year’s forecasts.
3. Funding/Capital Stack
The company’s board has approved the use of a Qualified Institutional Placement to fast-track the raising of 2.994 crore as additional capital, thereby reducing the dilution of the government stake to a maximum of 3.76%. The expanded funding buffer is expected to provide capital for growth at better funding terms.

4. Asset Quality
Even as the company’s loan book expands, concerns have emerged about rising non-performing assets in its loan portfolio. In 2026, traders will keep an eye on the trend of non-performing assets and also the trajectory of the provisioning for such assets. The stock’s risk factor is expected to decline if the company stabilizes both the trend in non-performing assets and the provisioning trajectory.
IREDA Share Price Forecasts for 2026: Institutional Targets
Institutional coverage of IREDA is limited, and there are very few analyst targets for 2026. MarketScreener lists one analyst forecast, which indicates a 150-rupee IREDA share price for 2026 with a Hold rating. There is an additional analyst forecast from Investing.com that also presents the same price target, but with a Neutral rating.
Base case: the stock ranges, with a potential selective upside move in 2026. This will see the price oscillate in the ₹122–₹150 range, as investors seek clarity on the impact of the capital raise and the trajectory of asset quality. Growth trajectory must also be maintained.
Bull case: the stock making a sustained move above the ₹150 price mark, but this would depend on credit cost stabilization and disbursements/loan sanctions remaining strong.
Bear case: the bear case scenario sees the stock trading below the ₹122 price mark, with an increase in non-performing assets, additional provisioning for these toxic assets, QIP pricing, and credit overhang being the main drivers.
IREDA Share Price: Technical Outlook
The weekly chart shows the price broke below the lower border of the descending triangle at 139.72, effectively setting the stage for the downtrend seen on the chart. The breach of the 127.87 support mark (70.5% Fibonacci retracement of the 28 Nov 2023 – 15 Jul 2024 upswing) has been followed by an attempted pullback to the upside.
If the bears defend the degraded support (now resistance) at 127.87, it sets up a decline towards the completion point of the triangle’s measured move at 105.95 (78.6% Fibonacci retracement).
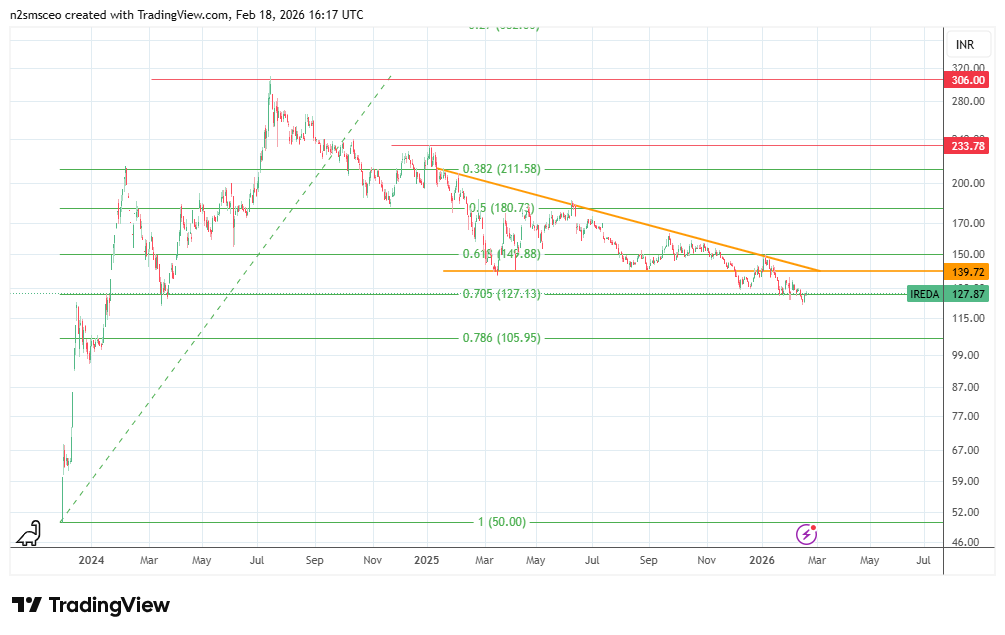
On the flip side, any recovery in the stock must follow the uncapping of the 149.88 price mark (61.8% Fibonacci retracement) and the descending trendline. This sets up a move towards the 180.73 resistance (50% Fibonacci retracement and highs of Q2 2025). Only if this level is cleared will the February 2024 high at 211.58 (38.2% Fibonacci retracement) become visible.