- Summary:
- In this article, we look forward to the Royal Dutch Shell Share Price and what we should expect going forward as its golden cross approaches
Royal Dutch Shell share price is in consolidation mode as investors start to question the soaring crude oil prices. Shell’s class B shares have dropped by more than 0.60% to 1,409p while the class A shares have fallen by more than 0.35%. Similarly, BP share price has dropped by 0.20%.
What’s happening: Shell share price has had a strong run after bottoming in 2020. The shares have risen by more than 66% from its bottom last year. This performance was due to the overall higher oil prices and hopes that the company will recover.
To a large extent, things have been positive for Shell. For one, after dropping sharply last year, the price of crude oil has bounced to above $50. This is slightly below where it started the year at. Also, scientists have already come up with a coronavirus vaccine, which has increased the possibility that demand will pick up.
But. But: However, BP and Shell share prices faces several risks going forward. First, while the price of crude oil has been rising, there are early signs that the strength is waning. Second, the new coronavirus outbreak in China means that demand of oil could continue waning. In fact, this week, the Energy Information Administration (EIA) warned that demand could be subdued. Third, the companies could face more taxes and regulations in the new Biden administration.
Royal Dutch Shell Share Price Forecast
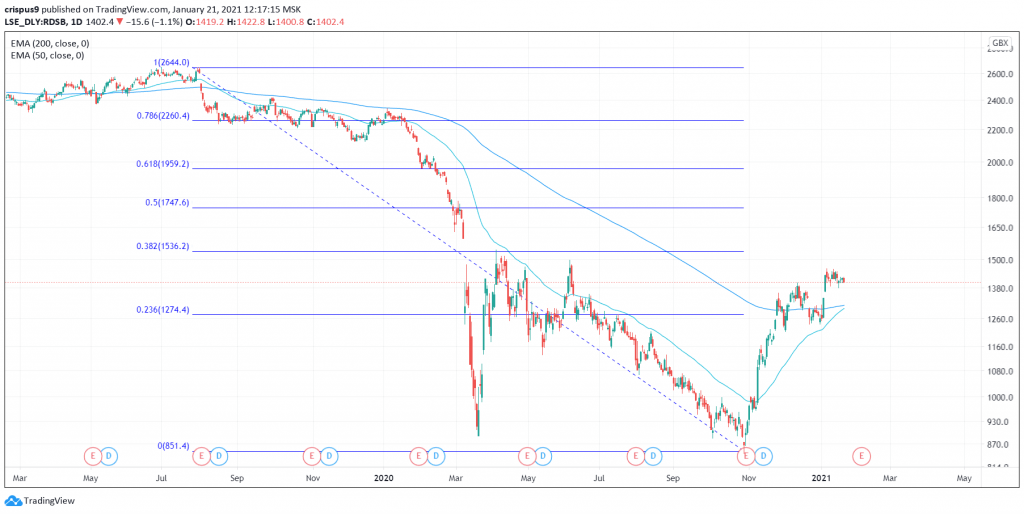
On the daily chart below, we see that the Royal Dutch Shell share price has been in consolidation mode in the past few days. This has happened when the price is between the 38.2% and 23.6% Fibonacci retracement level.
Most importantly, the golden cross – when the 50-day and 200-day EMAs – cross is approaching. Therefore, the shares will likely break-out higher. If this happens, the next key level to watch will be 1,500p followed by 1,600p.
RDSB Share Price Chart


