- Summary:
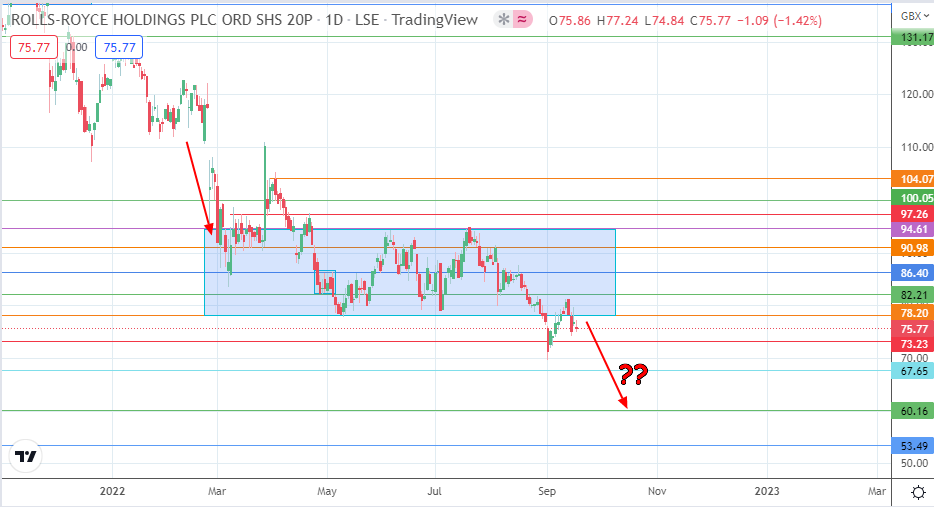
- The rectangle pattern points to a potential drop in the Rolls Royce share price to a downside target of 60.16p.
The Rolls Royce share price is not up for trading this Monday due to the bank holiday to mark the late Queen Elizabeth’s state funeral. So what will traders expect to face when returning to the trading floors on Tuesday?
They will meet a stock that ended the week lower despite new initiatives by the company to develop alternative propulsion systems based on green energy. These initiatives are expected to support the stock in the long term. However, the short-term picture confronting UK aviation stocks and the companies that operate in this sphere looks negative.
Rolls Royce’s share price has been on a downward spiral since the 1st quarter of the year, as what should have been a stellar recovery period for the UK aviation sector has been marred by worker absences and strikes by different aviation sector unions. Thousands of flight cancellations later, and the Rolls Royce share price is now teetering around the mid-2020 pandemic lows.
2023 is expected to bring recovery for Rolls Royce in terms of earnings per share and profits. Citi’s analysts predict an EPS of 1.48p in 2022 and 4.16p in 2023. So while the stock’s recovery in 2023 is not in doubt, the question is, how far will the stock fall before it starts to rise again? The pattern indicates that a run to 60.16p may not be out of the question.
Rolls Royce Share Price Forecast
The breakdown of the rectangle pattern by the 31 August candle was followed by an attempted return move, which was rejected at the 82.21 resistance. This has left the price below the rectangle but above the 73.23 support level (3 August 2020 low).
Further downtrend continuation requires a breakdown of this support level and the low of 1 September 2022 at 70.00. This scenario would see downside targets such as 67.65 (6 November 2020 low) and 60.16 (14 October 2020 low) enter the mix as new targets.
On the flip side, breaking the 82.21 resistance allows further recovery to the north. This makes 86.40 (18 May high and 17 August low) and 90.98 (25 April and 29 July 2022 highs) potential northbound targets. Additional price barriers are found at 94.61 (rectangle’s upper boundary) and 97.26, where the 21 April 2022 high is located. The 6 April high forms a psychological target at 100.05, while 104.07 comes into the picture on a further advance.
RR: Daily Chart


