- Summary:
- The REEF price saw a sudden surge in activity, ending higher for four straight trading days, before retreating in Sunday's session.
The Reef price saw a sudden surge in activity, ending higher for four straight trading days, before retreating in Sunday’s session. Between Wednesday and Saturday of last week, the Reef Finance Token (REEF/USD) saw constant buying pressure, which lifted the price from $0.0196 to $0.0335.
The recent run-up is due to the launch of Reef Chain v7, which includes several significant network improvements. Also, three days ago, @cryptodailyuk recognised the DeFi platform, built on Polkadot, as a ‘promising blockchain project to watch’. As a result of the recent news, REEF recovered all of Septembers losses last week, and by Sunday, the token was trading at a four-month high of $0.0335. However, the price has pulled back around 17% to $0.0284 on profit-taking in the last 24-hours. Nonetheless, the REEF token is holding key support levels, and the outlook remains constructive.
Technical Analysis
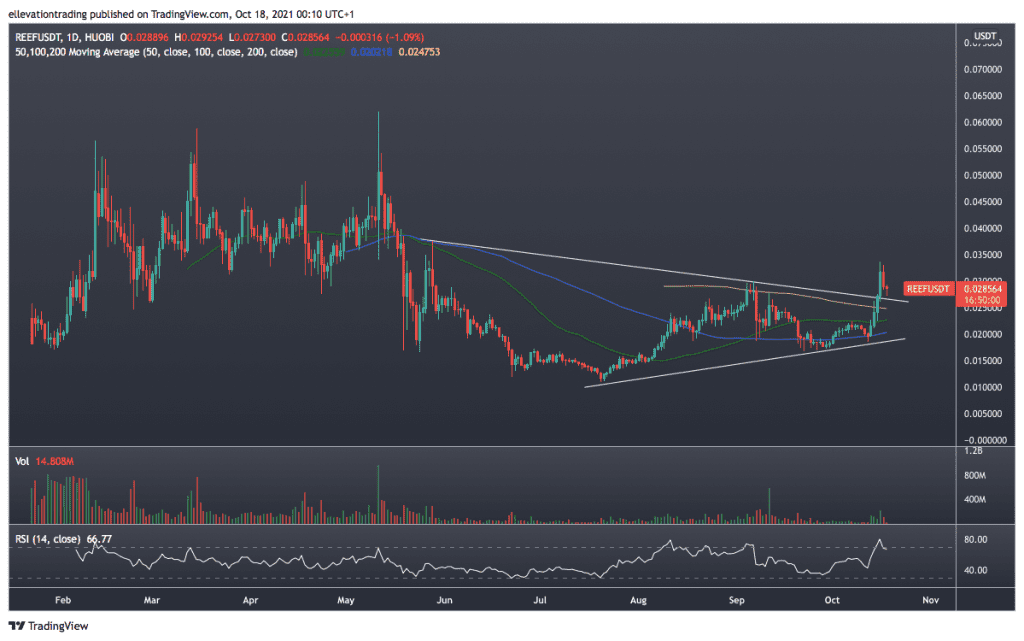
The daily chart (REEF/USDT) shows the recent move lifted REEF above the 50, 100, and 200-day moving averages. Furthermore, the price has cleared trend resistance at $0.0266. As a result, the former resistance now offers the first level of support.
As long as the REEF Price holds above the trend support, a bullish bias is likely, targeting the 28th of May high of $0.0374. However, the Relative Strength Index (RSI) at 66.50 is turning lower, indicating exhaustion. Furthermore, the light trading volume suggests the impulse move higher failed to attract large scale buying. As a result, holding the trend is imperative to keep the bullish momentum alive. If REEF drops back into trend, the 200-day moving average (DMA) at $0.0247 is the first significant support, followed by the 50 DMA at $0.0225.
REEF Price Chart (Daily)

For more market insights, follow Elliott on Twitter.


