- Summary:
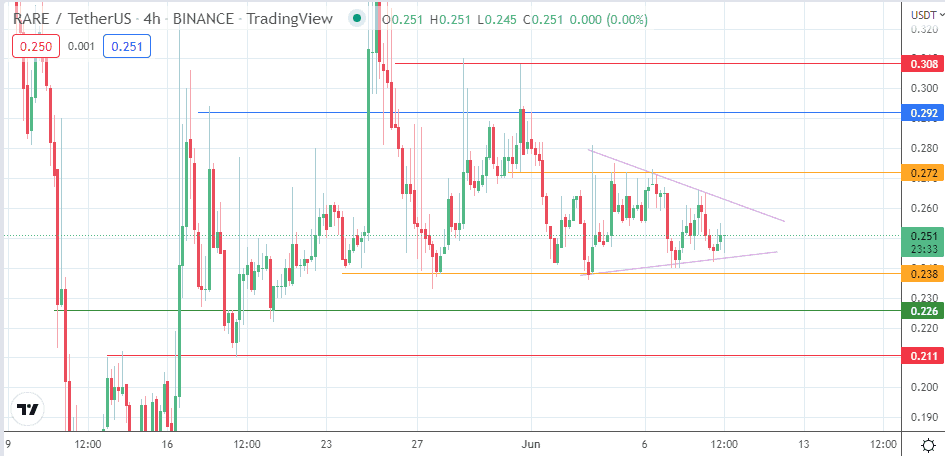
- The symmetrical triangle/double bottom patterns on the 4-hour chart could decide the direction of new RARE price predictions.
This week has seen several altcoin tokens consolidate into discernable chart patterns. This scenario has given traders a rare opportunity to trade the expected outcomes of these patterns without the interference of fundamental triggers.
With the crypto market being dictated by sentiment around Bitcoin and not by inherent fundamentals within each ecosystem, it is possible to analyse where the RARE/USDT token will go when the patterns resolve. This Thursday, a bounce on the lower edge of an emerging triangle pattern has enabled the bulls to gain the upper hand.
The 1.62% uptick in the first bullish day in three for the RARE/USDT pair and it still leaves a long way to go if the bulls are to win the war here. However, the prevailing trend before the pattern’s formation is more or less bullish. This gives the print a bullish tilt regarding where the RARE price predictions could go once the patterns are resolved.
The RARE network is the token of SuperRARE, the NFT marketplace that now has a new feature that allows the collectors of NFT artworks to earn royalties on their trades.
RARE Price Prediction
The symmetrical triangle’s lower border remains intact following the bounce. This bounce also forms an evolving double bottom pattern if the troughs of 7/9 June are considered. The break of the upper border of the triangle (which also functions as a neckline to the evolving double bottom) opens the door for a potential measured move that terminates at the 0.292 resistance level (17 May and 1 June highs). A break of the 0.272 resistance (6 June high) is required for the measured move to attain completion. The 29 May/31 May highs at 0.308 complete the potential near term targets to the north for the RARE/USDT pair.
On the flip side, a breakdown of the lower border of the triangle invalidates the double bottom formation and opens the door for a potential measured move that targets the 0.226 price mark (). The 14 May high/19 May low at 0.211 is an extended support target. However, the attainment of the 0.226 and 0.211 support targets can only happen if the bulls fail to defend the 27 May low at 0.238.
RARE/USDT: 4-hour Chart


