- Summary:
- AMP crypto price has made a spectacular rebound in the past few days. The highly embattle token has jumped to a high of $0.0057
AMP crypto price has made a spectacular rebound in the past few days. The highly embattle token has jumped to a high of $0.0057, the highest level since September 15. It has jumped by more than 71% from the lowest level in 2022. As a result, its total market cap has surged to more than $212 million, making it the 135th biggest crypto in the world.
Why is AMP soaring?
Amp is a blockchain platform that was meant to disrupt key sectors by making it possible for people to collateralize any asset in the blockchain industry. It works by decentralizing the risk involved in transaction finality and reduce the assurance cost from existing counterparty networks. It also serves as a medium for accruing value while aligning the incentives of all participants.
Therefore, Amp serves an important role by ensuring that any crypto token can be collateralized. As such, it can be used by payment networks and other players in the DeFi ecosystem. Amp can also be staked, mostly using platforms like Flexa Network. Data by Dune Analytics shows that the number of Amp holders has jumped to an all-time high. Similarly, the amount of staked Amp has also soared
It also explains why Amp price plunged in 2022 as demand for crypto collateral waned. The total value locked (TVL) in DeFi plunged from more than $250 billion to less than $50 billion.
Amp price prediction
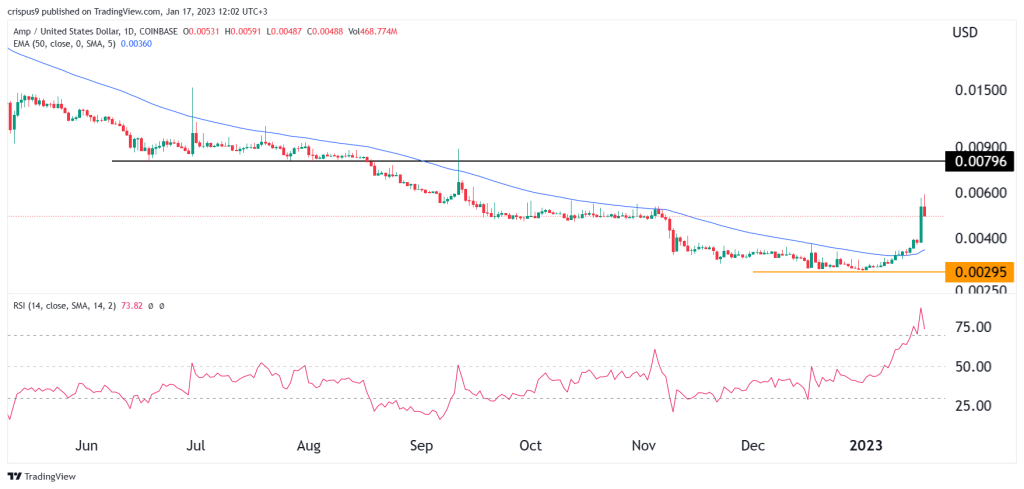
The daily chart shows that the Amp token has been in a strong bullish trend in the past few days. It has moved from a low of $0.0029 to a high of $0.0058, which was the highest point since October. As it rose, the token managed to move above the 25-day and 50-day moving averages while the Relative Strength Index (RSI) moved to the overbought level.
Therefore, I suspect that the Amp crypto price will continue rising as buyers target the key resistance level at $0.0080. A drop below the support at $0.04 will invalidate the bullish view.