- Despite the volatility, the Polkadot price is unchanged for September and is struggling for direction in a broad sideways channel.
Despite the volatility, the Polkadot price is unchanged for September and is struggling for direction in a broad sideways channel. Like most of the market, Polkadot (DOT) was firmly in up-only mode coming into the first half of the month. By the 14th, DOT had jumped 285% from the July low and was doing business at $39.50. However, by the 20th, Polkadot was 30% lower as the market digested the collapse of Evergrande.
The crypto market made a swift recovery from the risk-off following the Chinese property developers default. In the second half of last week, Polkadot resumed the march upward, jumping 30% and recovering most of the losses suffered at the start of the week. However, the rally was also short-lived, and on Friday, DOT dropped 9% after the Peoples Bank of China’s (PBoC) announced a total ban on cryptocurrencies. As a result of the toing and froing, DOT looks undecided, perplexing both sides of the trade.
DOT Price Analysis
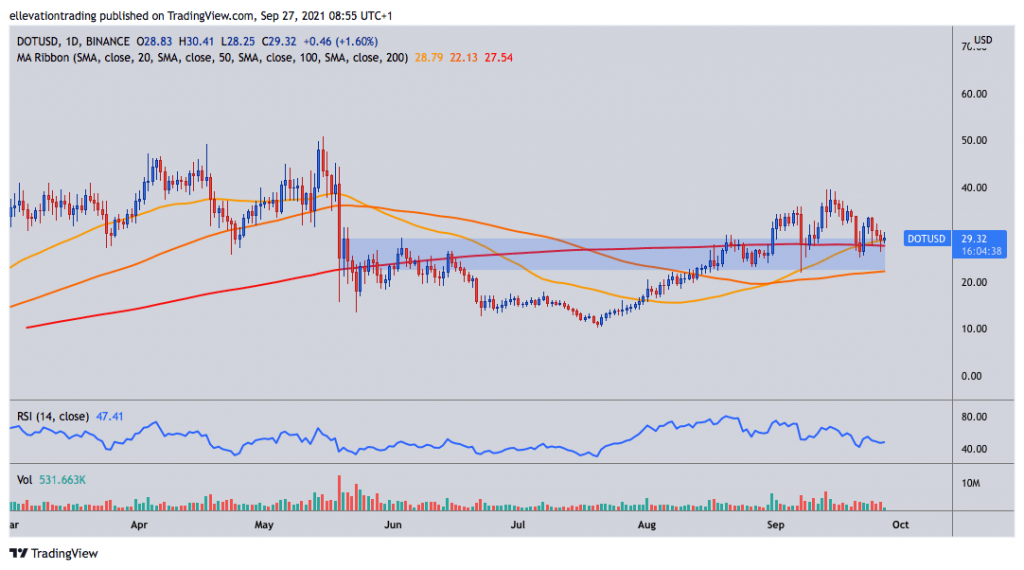
The daily chart shows that the Polkadot price has gyrated on either side of the 200-day moving average at $27.54 since August, highlighting the lack of a dominant trend. Also, the Relative Strenght Index’s (RSI) neutral reading of 47 points to a market in balance, neither oversold nor overbought. Additionally, a lack of trading volume also indicates a certain amount of apathy at this price point. Therefore, in my opinion, the Polkadot price could go either way from here.
To resume its uptrend, DOT must first clear the September 14th high at $39.50. The 50-DMA at $28.79 and the 200 DMA at $27.54 provide significant support, and as long as DOT stays above $27.54, it can rally. However, if Polkadot loses the 200 DMA, a drop to the 100-day average at $22.13 is likely.
Polkadot Price Chart (daily)

For more market insights, follow Elliott on Twitter.


