- Summary:
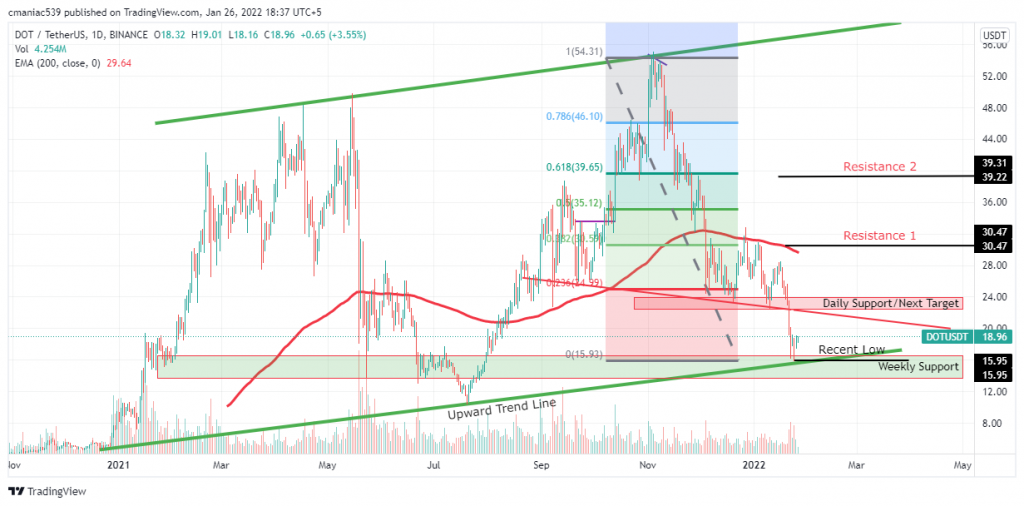
- A sigh of relief for Dot investors as the price bounces off a yearlong trend line which started back in December,2020.
Polkadot was launched in 2020 after nearly 3 years of extensive research & development. Dr. Gavin Wood’s brainchild has received much traction since then with thousands of developers flocking to the platform in 2021. Unlike Ethereum, Polkadot aims to be a network of blockchains aka parachains. 1st round of these parachain auctions was carried out in November, 2021 where Acala, Moonbeam, Aster and Clover Finance secured their spots. Successful projects were then onboarded by Polkadot later in December 2021.
The 2nd round of auctions started on 23rd December 2021 with the auction for 1 parachain slot scheduled per week. There are 12 different projects which are competing for 6 parachain slots on Polkadot in ongoing auctions. The successful projects will then be onboarded by Polkadot on 11th March later this year.
With many parachain launches already in the pipeline, 2022 is all set to witness a huge network activity on Polkadot. This together with a huge dot supply locked for parachains, may provide a myriad of opportunities for crypto investors.
Polkadot Price Outlook
Even after a successful launch of the first set of parachains on the network, the price of the native asset of Polkadot (i.e., Dot) is still looking quite bearish. The price failed to bounce off the daily support at $22-24 and closed below 0.786 fib level which is drawn by joining July 2021 lows ($10.37) to ATH ($55.09) in Nov 2021.
However, one sigh of relief for Dot investors is the recent bounce off a yearlong trend line that started back in December 2020. If the bulls continue to push the price up, then connecting the recent Monday low of $15.90 to ATH ($55.09) gives us the first Fibonacci target of $30.50 at 0.38 level, where it might run into some resistance at the daily chart. But before heading further upwards, dot price needs to reclaim the $22-24 level first.
It is also worth noting that a confirmed break below this yearlong trend line can send Dot price into a deep downtrend which might take it below $10 within a very short time.
DOTUSDT Daily Chart


