Polkadot price has been under pressure after the cryptocurrency flipped to become the fourth biggest digital currency in the world. The DOT is trading at $15.90, which is slightly below the Friday’s all-time high of $19.40. This means that it has dropped by more than 18% in the past four days alone. Its market cap has fallen to $15.88 billion, making it only smaller than Bitcoin, Ethereum, and Tether.
At the same time, Stellar lumens price (XLM) too has been struggling after it reached its all-time high of $0.43 early this month. In fact, it has dropped by more than 35% since January 2, bringing its market cap to more than $6.41 billion, making it the 11th largest digital currency in the world.
So, what next for Stellar and Polkadot prices?
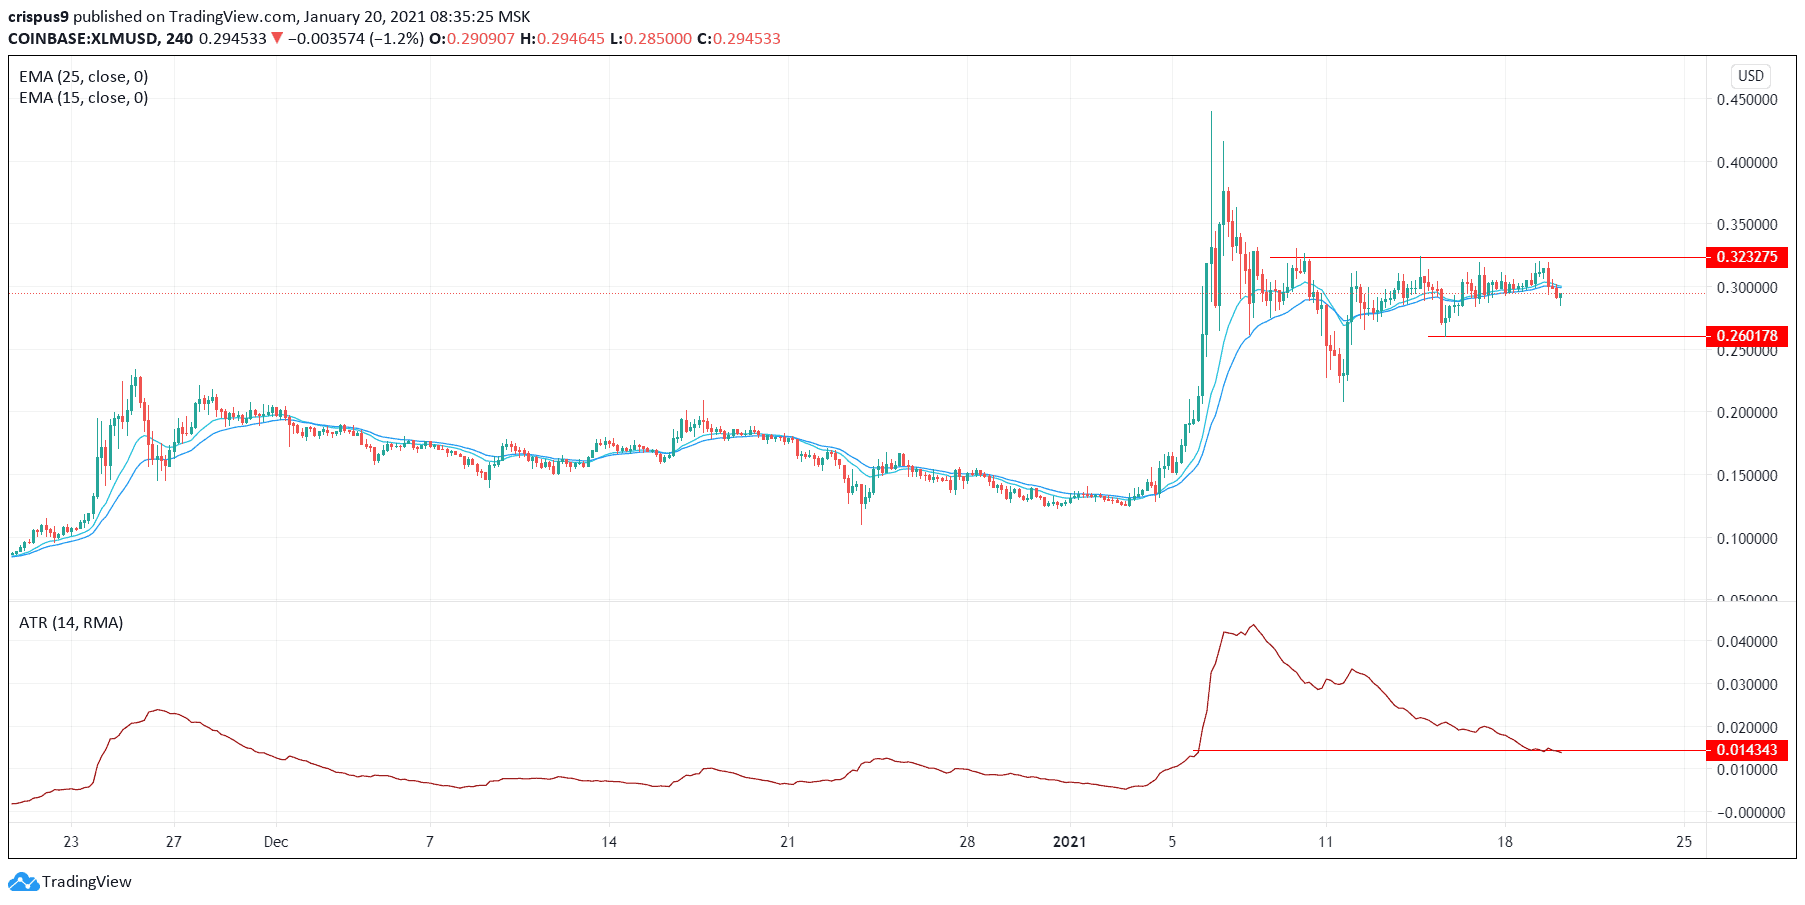
A look at the four-hour chart shows that Stellar Lumens price has been struggling in the past few days. The price has been moving sideways in the past few days, pushing its volatility, as measured by the Average True Range (ATR) to the lowest level since January 6.
Also, the price is at the same level as the 15-day and 25-day exponential moving averages (EMA). Therefore, for today, I suspect that the Stellar price will remain at the current range. However, you should be on the lookout for the support and resistance levels at 0.26 and $0.32, respectively.
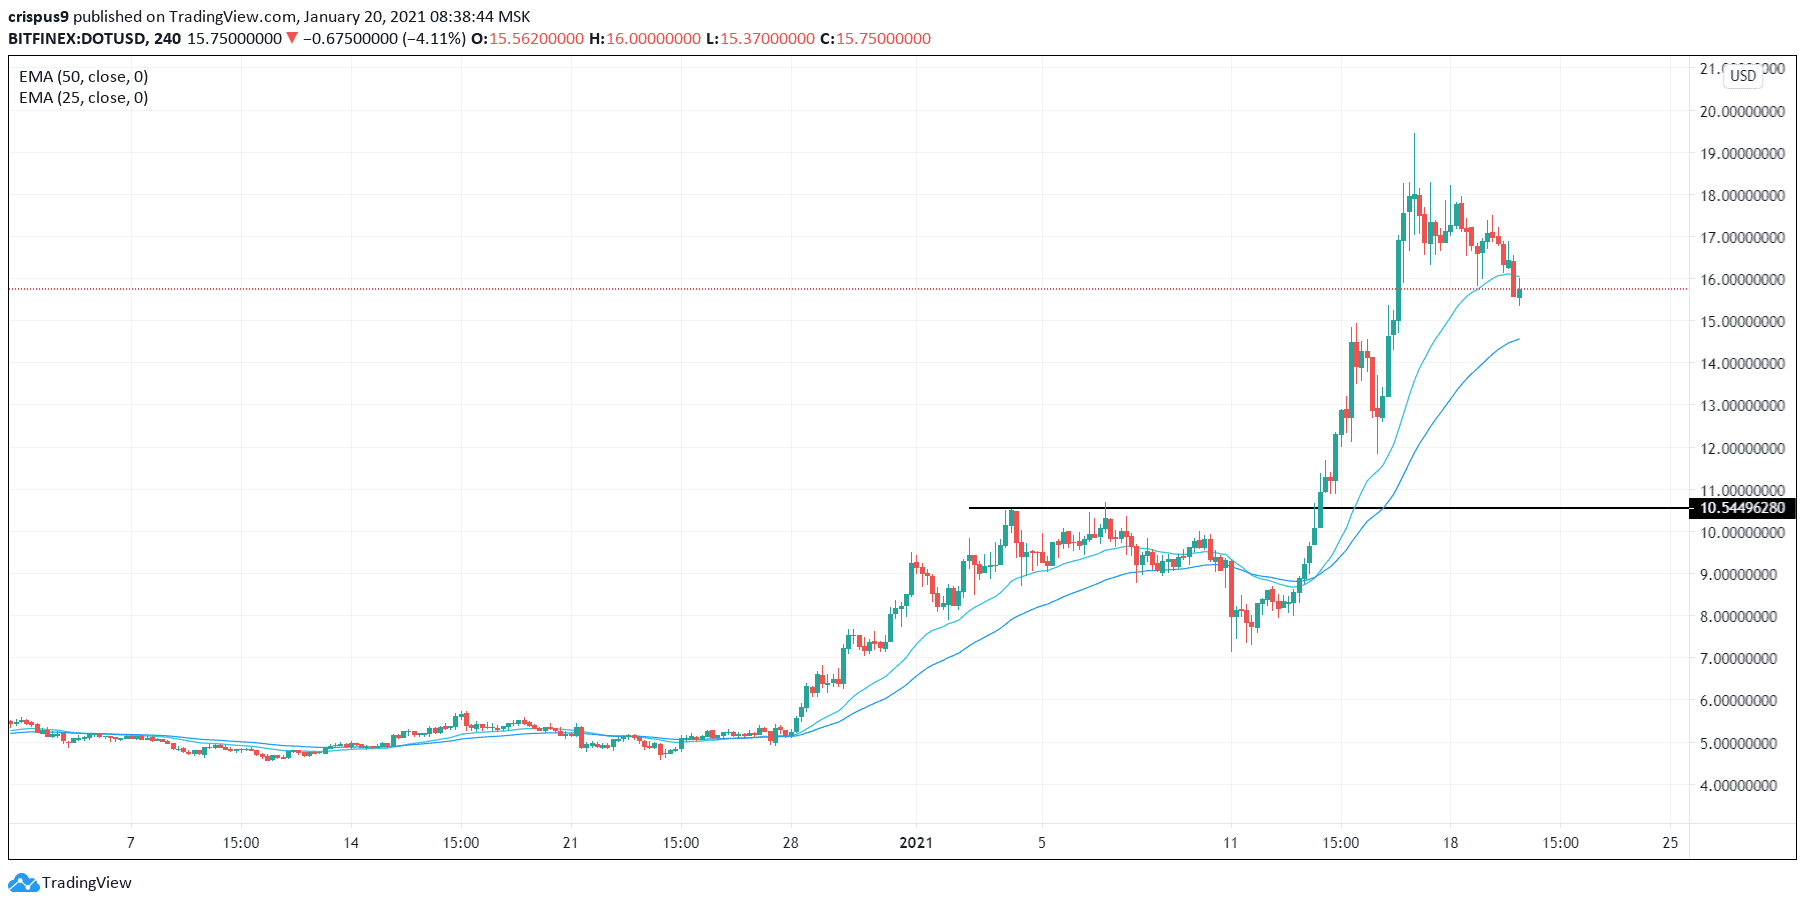
The four-hour chart shows that the Polkadot price has been struggling recently. It has fallen by more than 17% after it reached its all-time high. This weakness is mostly because of the profit-taking among bullish traders and pressure from short-sellers.
It has also moved below the 25-day EMA and is slightly above the 50-day EMA. Therefore, the price will likely continue moving slightly before bouncing back eventually.