- Summary:
- PEPE has recently signaled fading volatility, comparable to what became of SHIB and DOGE. We diagnose the signs and implications.
PEPE price stayed on the ascending lane on Friday but printed out another underwhelming gain for an asset that had established a reputation for double-figure spikes in the months gone by. The frog-themed meme coin was up by 0.3 percent to trade at $0.00000802 as of this writing, putting it on course to register the first weekly gain in five weeks.
That PEPE has gained 10 percent this week, with no single double-digit gain on the daily chart points to its potential waning popularity. Could it be following in the footsteps of Dogecoin and Shiba Inu? Recent data would suggest so. PEPE price is up by 518 percent YTD and gained 512 percent in the last six months.
However, it is down by 35 percent in the last month, and has printed out red candlesticks in each of the last three months. This could be a sign that PEPE’s volatility could be cooling down, and the token’s holders could be looking at smaller, but stable gains with periodic drops, as seen with OG meme coins, Dogecoin and Shiba Inu.
Momentum indicators
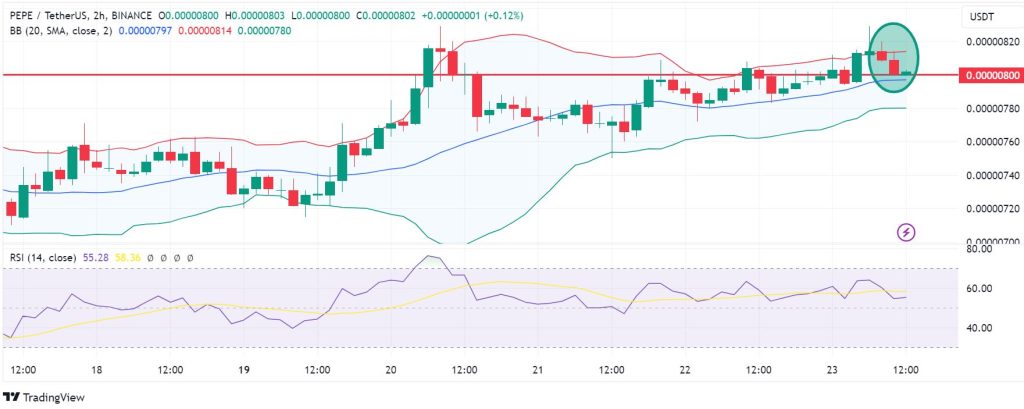
As of this writing, despite its week-long gains, PEPE’s 24-hour trading volume was down by 19 percent, according to CoinMarketCap. The indicators on the 2-hour chart signal that the buyers still retain control of the market, but the fightback by the sellers is almost equally as strong.
The price has consistently remained above the middle Bollinger Band, but got regected at the upper band. It curretly floats marginally above the psychological round figure of $0.00000800, making it a potential support level. Meanwhile, the RSI is at 55, which adds support to the upside view.

PEPE price support and resistance levels
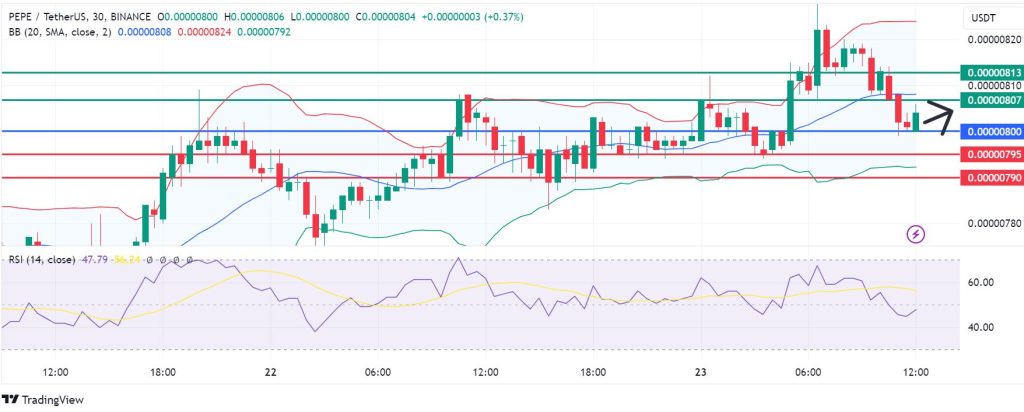
PEPE signals signs of bullish control above the 0.00000800 pivot mark. That could see the buyers encounter the first resistance encountered at 0.00000807. However, on further control, the buyers could clear that barrier and target the next resistance at 0.00000813.
Alternatively, moving below 0.00000800 will favour the sellers to take control. In that case, we could see the first support established at 0.00000795, but extended control could enable them to breach that level. That could render the upside narrative invalid and potentially result in a stronger downside momentum to test 0.00000790.


