- Summary:
- PCBL share price is likely to snap an eight-week winning streak, but the underlying momentum points to a potential reversal. We tell you how.
PCBL share price rose marginally on Friday, inching up by 0.9 percent in the intraday session to trade at Rs 486.10 at the time of writing. The stock is attempting to recover after last week’s drop in performance, which disrupted an ascending trajectory that started mid-August. However, it looks likely to register the first weekly loss in nine weeks. Nonetheless, three successive rises in the last three days signal a potential upturn next week.
Despite meeting headwinds in recent days, PCBL Ltd (NSE: PCBL) gained 45.6 percent in August and is up by 93 percent YTD. The upward momentum is helped by a positive sentiment created following the release of its Q1 2024 earnings report on August 8, in which it announced Rs 1.1 billion in consolidated net profits. The earnings met analysts’ forecasts and showed a significant rebound from the previous quarter, which missed earnings estimates by -25 percent.
PCBL share price today
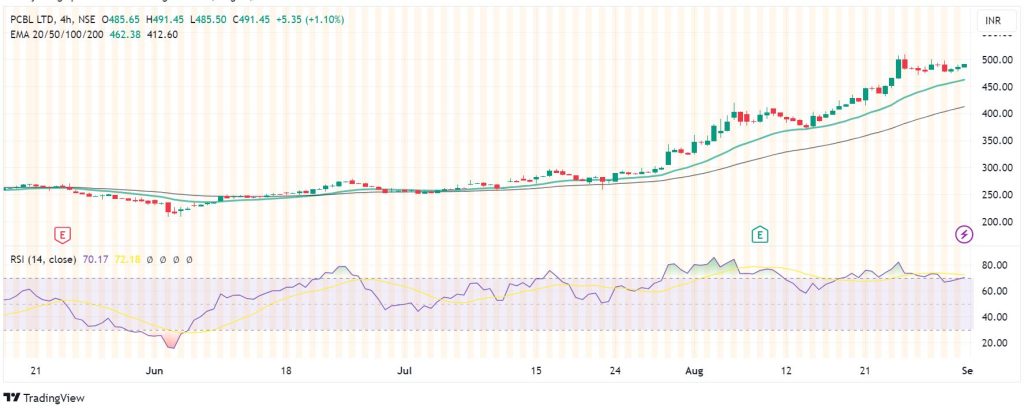
Momentum indicators
On the 4-hour chart, the momentum indicators for PCBL share price call for further upside. This view is supported by the momentum on the price, which is currently above the 20-EMA and 50-EMA. In addition, the 20-EMA is above the 50-EMA, and the RSI is at 70, signifying a strong bullish control. However, the RSI reading also indicates overbought conditions, which calls for caution, as the upward momentum could start weakening.
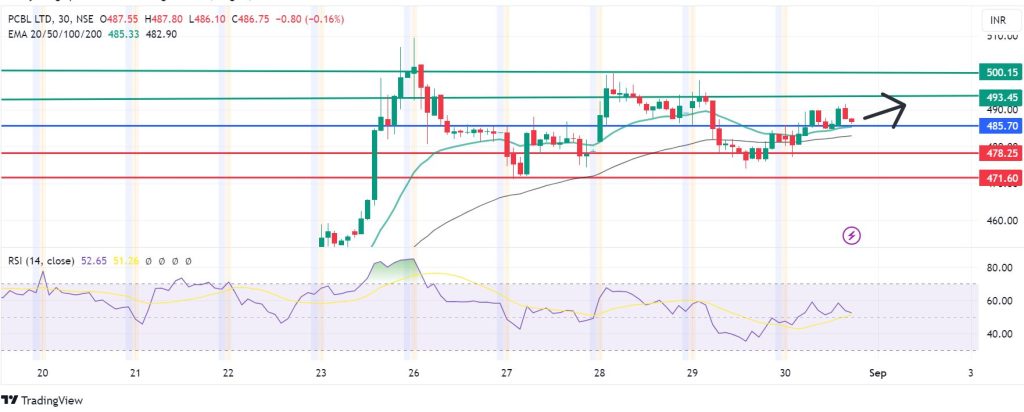
Support and resistance levels
The 30-minute chart favours the buyers to stay in control above the 485.70 pivot. With the buyers in control, the first resistance could come at 493.45. However, extended bullish momentum could enable them to clear that barrier and test 500.15. On the other hand, moving below 485.70 will favour the sellers to take control, with the first support likely to be at 478.25. However, further control by the sellers could enable them to break below the support and invalidate the upside narrative. Also, that could strengthen the downward momentum to test 471.60.