- Ola Electric share price is still more than 70 percent above its listing price two weeks ago, but recent losing streak is concerning.
Ola Electric share price extended its decline to the third successive trading session on Thursday, shedding 4.1 percent to trade at Rs 132.32 as of this writing. The stock listed at the BSE about two weeks ago, and while the share price is still 74 percent above its listing price, it is still experiencing volatility. There are questions as to the company’s fair value, considering its share price spike in a fortnight, which contrasts sharply with its $189 million loss for the Financial Year ending March 2024.
Some investors are understandably concerned that for a company whose losses have been growing in recent times, the current Ola Electric Mobility (NSE: OLAELEC) share price is not a true reflection of its intrinsic value. Therefore, it might take a few more days to find out whether we have a consolidation or a bubble.
That said, the company launched three variants of electric motorcycles on August 15, and that could potentially turn around its earnings record, bearing in mind the popularity of e-motorcycles in India. If the company manages to replicate its success in the e-scooter market, then the share price could head higher in the medium and long-term.

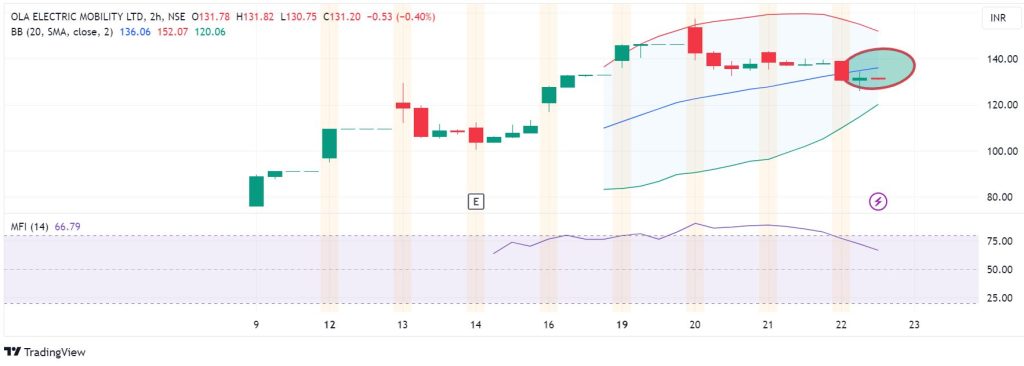
Momentum indicators
The momentum indicators on OLAELEC 2-hour chart signal that the upside momentum has lost steam, and the sellers have recently taken over the market. The price has broken below the middle Bollinger Band, which currently aligns with the Rs 136.06 level, showing bearish control.
Also, the Money Flow Index (MFI) indicator has been on a steep downward gradient. However, with the MFI reading at 66, the Ola Electric share price still has positive money flow-which denotes a bullish undercurrent. That could potentially result in a reversal.
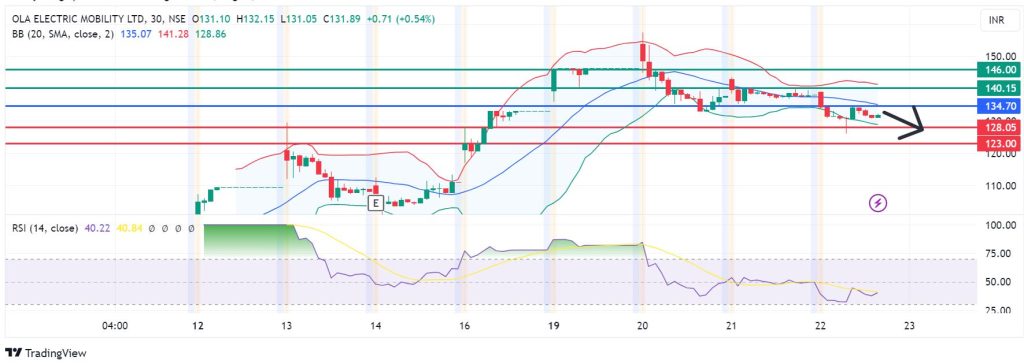
Support and resistance levels
The RSI indicator on the chart below signals control by the sellers below the 134.70 pivot mark. With the sellers in control, we could see the first support at 128.05. However, if the downside momentum prevails for longer, it could break that support and head to the second support at 123.00.
Otherwise, a move above 134.70 will signal control by the buyers. If that happens, they could head higher to encounter the first resistance at 140.15. However, further control buyers could strengthen the upside momentum to break the resistance and invalidate the downside narrative. Also, that could result in further gains to bring OLAELEC to test 146.00.