- Summary:
- Oil prices rose by more than 2% in the New York trading session on Thursday, with Iraqi and Libyan supply cuts outweighing demand fears.
Crude oil prices rebounded on Thursday, driven by concerns over potential supply disruptions in Libya and production cuts by Iraq. Benchmark Brent crude oil was up by 1.2 percent at the time of writing selling at $78.25 per barrel, while the West Texas Intermediate (WTI) climbed higher by 1.6 percent and traded at $78.51 per barrel at the time of writing.
Libya shut down operations at five oil export terminals following mounting tension between rival governments in Benghazi and Tripoli. The move threatens to cut off the nation’s 1.2 million barrels per day from the market for an unspecified period.
Elsewhere, Reuters reported on Thursday that Iraq plans to cut production by between 3.85-3.9 million barrels per day starting in September. That could add to the strain caused by the disruptions in Libya, which will most likely trigger a crude oil price hike. Meanwhile, oil prices also have an ongoing geopolitical premium brought about by the rising tension in the Middle East.
However, the emerging supply-side pressure could be inadequate to offset the demand dips in China. The world’s second-largest economy has been experiencing stagnation, with the April-June quarter growth rate of 4.7 percent, missing analysts’ forecast rate of 5.1 percent and declining sharply from a growth rate of 5.3 percent in the previous quarter.
The demand outlook for the US also adds pressure on oil prices, after the crude oil inventory data released on Wednesday came in higher-than-expected. The Energy Information Administration (EIA) reported a decline of -0.846 million barrels versus a forecast estimate of -2.7 million.
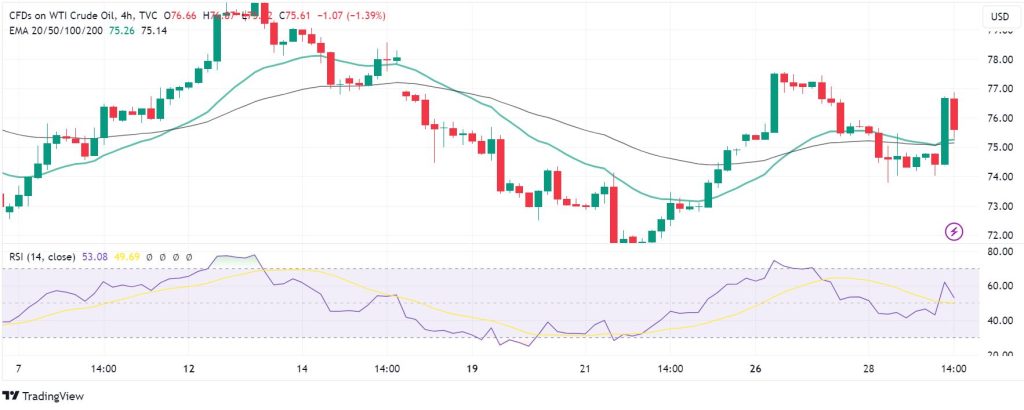
Oil price momentum chart
On the 2-hour chart, the momentum indicators signal bullish control, with the price above the 20-EMA and 50-EMA. In addition, the 20-EMA is marginally above the 50-EMA. Furthermore, the RSI adds weight to the upside view.
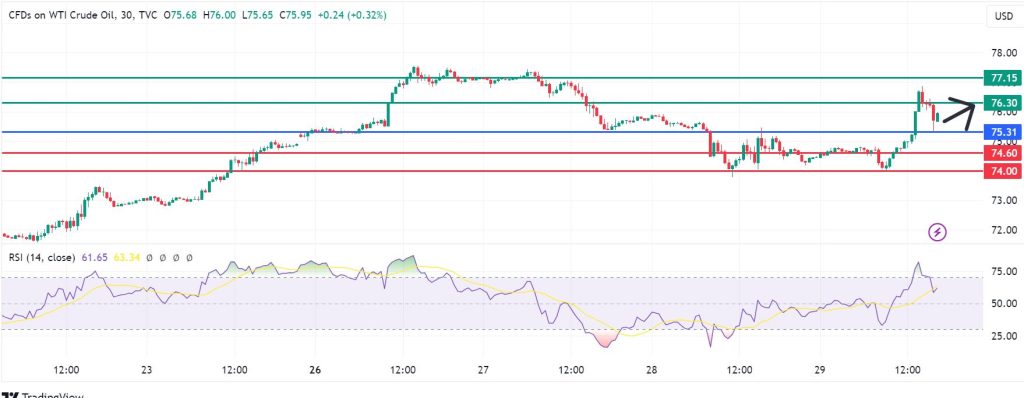
Support and resistance levels
The 30-minute WTI oil price chart signals a likely continuation of the upside above the 75.31 pivot mark. With the bulls in control, the upside momentum will likely encounter the first barrier at 76.30. However, if they extend their hold of the market, they could break above that barrier and clear the path to test 77.15.
However, the sellers could take control if the momentum sends the price below 75.31. The bearish momentum will likely establish the first support at 74.60, but extended control could enable them to breach that level and invalidate the upside narrative. Also, that could trigger further losses to test the second support at 74.00.