- The stakes are high for not only Nvidia share price, but also for the wider market ahead of the earnings release. Could NVDA beat forecasts?
Nvidia share price eased down on Monday as traders tamed their appetite ahead of a much-awaited earnings report release. The stakes are high across the markets ahead of the event, slated for Wednesday, as Nvidia (NASDAQ: NVDA) has established itself as not only the undisputed leader in AI chip industry, but also a barometer for the wider stock market.
At some point in the first half of the year, Nvidia almost single-handedly defined the stock market heartbeat. However, with fears of a potential inflation and some skepticism about possible AI bubble, the stakes are even higher this time around. Rarely does a stock have so much depending upon it outside its core industry.
With YTD returns of 156 percent, Nvidia stock price dwarfs versus the S&P 500’s 18.3 percent. Consequently, there are genuine fears that Nvidia could have potentially raised the bar too high, after skyrocketing to successive forecast-beating earnings.

During the fiscal first quarter 2024 earnings release, the management guidance targeted revenues of $28 billion this quarter. Wall Street analysts forecast a much-higher $28.6 billion. However, it is difficult to tell where the dice could settle in an environment of declining inflation and rising unemployment rate. As things stand, NVDA will likely trade sideways as traders exercise caution in the intervening period to the earnings release.
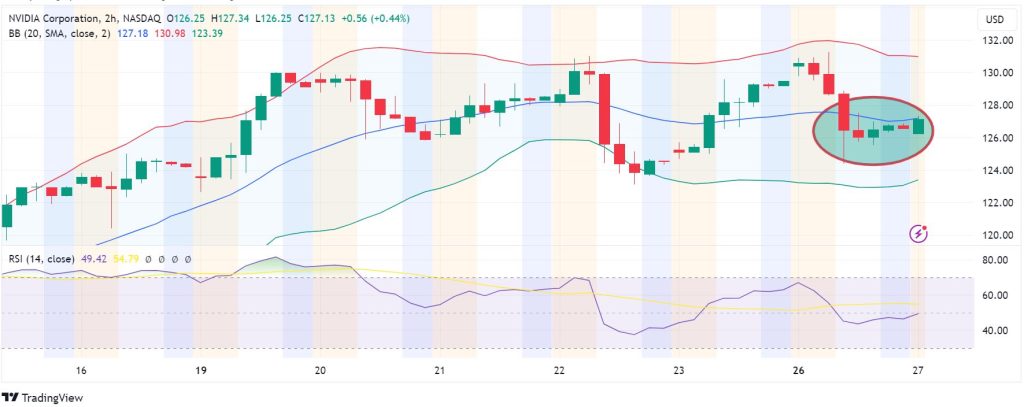
Momentum indicators
The 2-hour Nvidia price chart signals a neutral-bearish momentum going by the momentum indicators. The price is marginally below the middle Bollinger Band at $127.18, and this is also reflected by the RSI, whose reading of 49 aligns with the neutral-to-bearish narrative.
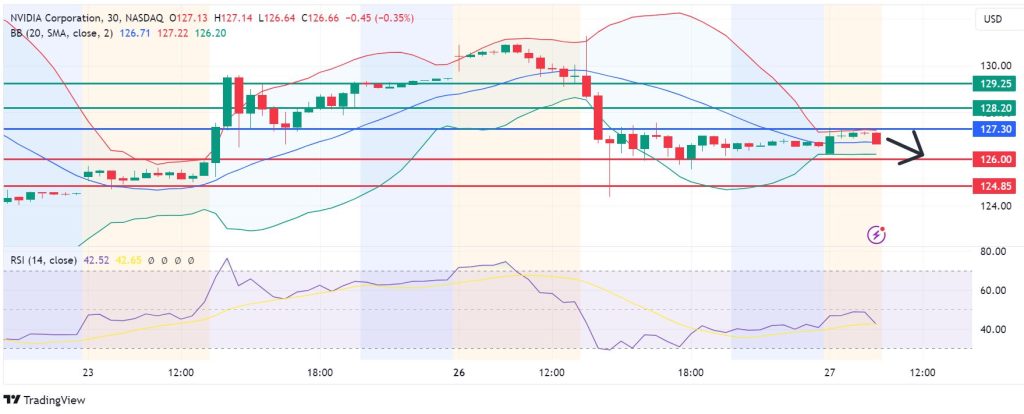
Support and resistance levels
The chart below calls for an extension of the downside action if resistance persists at 127.30. That momentum will likely establish the first support at 126.00. However, if the sellers stay in control, they will likely breach that support and test 124.85.
Conversely, a move above 127.30 will favour the buyers to take control. However, the upside could encounter the first resistance at 128.20. Extended bullishness at that point will result in a stronger upward momentum to break that barrier, invalidate the downward narrative and potentially test 129.25.