- Summary:
- The Netflix stock price forecasts indicate the potential for more selling to follow despite recent two-day gains.
The Netflix stock price forecasts that bet on the stock’s recovery appears to have received some support from the price action on the charts. The stock has opened trading for the day and is up 2.29% as of writing, as the bulls seek to consolidate Thursday’s gains. The 4.77% upside seen on Thursday followed bargain hunting as traders sought to snap up shares of beaten-down FAANG stocks.
However, the bearish sentiment still hovers around the stock amid the loss of its subscriber base and growth of the same metric by a rival, Disney+. Yesterday, we reported that Disney+ had seen a significant uptake in its subscriber base.
Netflix appears to have developed a solution to ramp up its revenue amid slowing growth in its streaming service subscription uptake. The company says it is fast-forwarding plans to introduce advertising into its streaming content. The change could come as early as December 2022, which is well ahead of earlier plans to introduce a lower-priced, ad-laden subscription package within the next two years.
The ad introduction and a crackdown on password sharing are measures to stem the financial bleed that occurred when the company lost 200,000 paying subscribers in Q1 2022, marking the first such loss in more than a decade.
The Netflix stock price forecasts also face headwinds from a lawsuit filed by shareholders who allege that the company withheld information about the decline in its subscriber base ahead of the collapse in its share price.
Netflix Stock Price Forecast
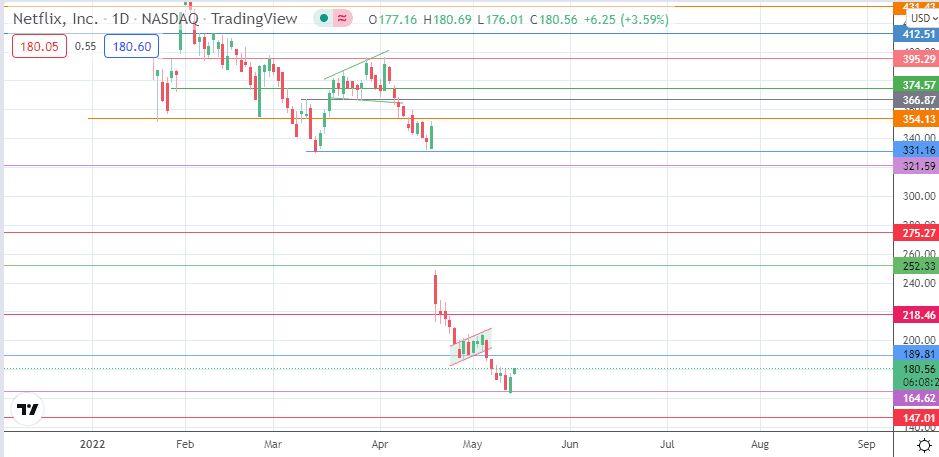
The intraday bounce on the 164.62 support level (17 August 2017 low) follows the daily chart’s completion of the bearish flag. The active daily candle must close above the highs of the last three candles to make it to the 189.91 resistance level (2 July 2017/21 September 2017 highs). A break of this resistance secures passage towards the 218.46 barrier (25 April 2022 high).
Attainment of 252.33 and 275.27 (5 April 2018/31 October 2018 lows in role reversal) requires the bulls to uncap the resistance at 218.46. A successful push toward the 331.16 resistance (14 March and 18 April lows) will close the downside gap.
Conversely, the breakdown of the 164.62 support opens the door toward the 147.01 price mark, leaving the 129.84 pivot (12 January 2017 low) as the additional southbound target. The 13 April 2016 high/14 November 2016 low form additional support level at 111.31.
Netflix: Daily Chart


