- Summary:
- The Nasdaq 100 continued the relentless March higher yesterday, printing it's latest all-time high and closing the gap on 16,000.
The Nasdaq 100 continued the relentless March higher yesterday, printing it’s latest all-time high and closing the gap on 16,000. Yesterday’s dismal ADP print encouraged the tech-heavy Nasdaq 100 to its highest ever price as fears of a taper gave way to fears of stagflation. Private payrolls for August gained a modest 326k, well short of the predicted 638k, prompting concerns that tomorrow’s Non-farm payrolls data will be a huge miss. If that’s the case, the Fed may be forced to rethink its taper plans.
The economic data has started to crumble at the worst time possible. Just as the Fed is contemplating reeling in the markets safety net, the CITI US Economic surprise Index is at its lowest point since the start of the pandemic. Furthermore, inflation continues to soar, which raises the threat of stagflation. However, this is good news for the Nasdaq 100.
Fed Chair Jerome Powell’s address following last week’s Jackson Hole symposium suggested tapering would start by the end of this year. However, Powell also told us that rates would remain at the current level until he sees a sustained recovery in employment. This sent the Nasdaq higher by 178 points on Friday to test the resistance of a long term trendline that started exactly one year ago. Furthermore, if tomorrow’s NFP misses, the taper may also be off the table, and the trend resistance could become trend support.
Technical Analysis
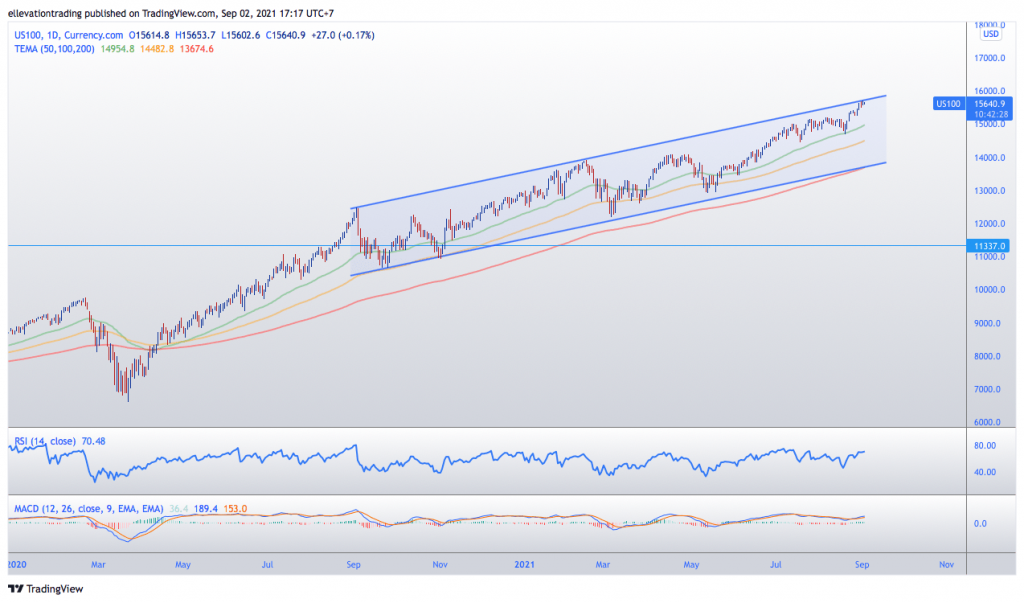
The daily chart shows that the Nasdaq 100 has been trading higher for the last 12 months, resulting in a rising trend channel. The channel’s top edge, which began on the 2nd of September 2020, is currently seen at 15,700. On that basis, a successful clearance of 15,700 could lead to an extension higher. Although, to where is hard to say. N
However, this hinges on tomorrow jobs data. If the payrolls somehow contradict the ADP numbers and come in as expected, the Nasdaq 100 could reverse sharply lower. In that event, the first target for the bears is the 50-day moving average at 14,950. Although, the signs are that the bulls are still firmly in control for now.
Nasdaq 100 Price Chart (Daily)

For more market insights, follow Elliott on Twitter.


