- Summary:
- The Nasdaq 100 index is leading other US markets higher as the drop in the core CPI (M/M) boosts market sentiment.
The Nasdaq 100 index has staved off its recent losing streak and is up 1.77% on the day. Gains in the asset have accelerated with the latest headline and core US Consumer Price Index (CPI) data releases.
Data from the US Bureau of Labor Statistics indicates that US consumer inflation rose 8.5% in March on an annualized basis consensus of 8.4%), while meeting the 1.2% month-over-month estimate. Core CPI dropped from 0.5% a month earlier to 0.3%, which was below the market estimates of 0.5%. The surge in the headline inflation number reflects higher food costs and runaway energy prices, which are currently at highs last seen in December 1981.
The stock markets were expecting the impact of stratospheric food and energy prices, and this was largely priced in. Instead, the focus was on the core number, which discounts food and energy prices. With the core CPI figure dropping below the previous/consensus figures, the expectation is that the Fed may slow down on its tightening program.
The selloff in the long-term US bonds market is also helping to accelerate gains in the stock market. The US 10-year bond instrument is down 2.66% on the day, snapping a 7-day winning streak. This is promoting investment flows into the riskier equities markets following the boost the lower core CPI has given to bullish sentiment in the stock market. The core CPI’s drop is responsible for the 1.83% uptick in the Nasdaq 100 index.
Nasdaq 100 Index Outlook
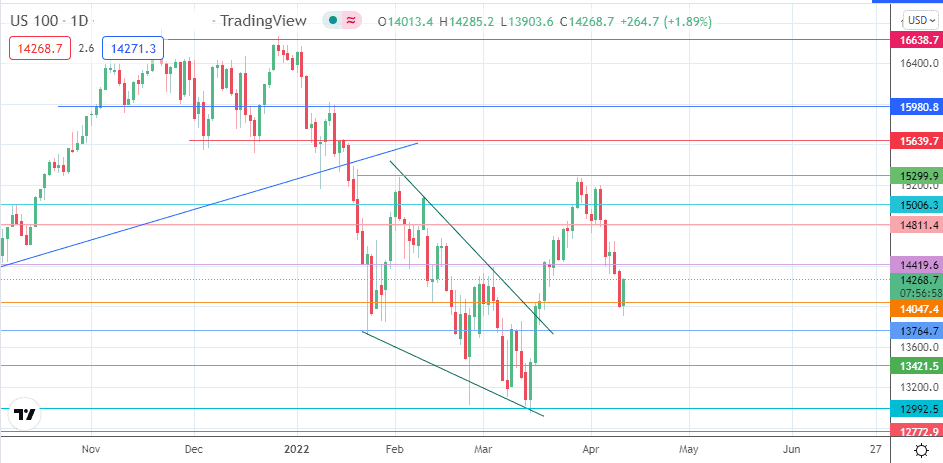
The daily chart’s bounce on the 14047 support continues to gain momentum, targeting 14419 (27 January and 3 March highs) in the first instance. If the price action takes out the resistance at 14419, the door towards 15006 (7 October 2021 high, 19 January 2022 low) swings wide open. 15299, where the previous double top of 29 March 2022 formed, is an additional target that enters the picture on a continued advance.
On the flip side, the bears would be seeking for a breakdown of the 14047 support to extend the slide towards 13764. 13421 (4 May 2021 and 16 March 2022 low) and 12992 (15 March 2022 low) round off additional short term targets to the south.
Nasdaq 100: Daily Chart

Follow Eno on Twitter.


