- Summary:
- It is a sea of red in global stocks as traders react to the Fed decision. The Dow Jones, Nikkei 225, Nasdaq 100, DAX Index and FTSE 100 are all down sharply
It is a sea of red in global stocks as traders sell-off the Federal Reserve interest rate decision. In the United States, futures tied to the Dow Jones, S&P 500, and Nasdaq 100 are down by 1.25%, 1.44%, and 1.65%, respectively.
In Asia, the Nikkei 225, Hang Seng, and China A50 are down by 0.70%, 1.70%, and 0.83%, respectively. Similarly, in Europe, futures tied to the DAX index, CAC 40, and FTSE 100 are down by more than 1.50%.
Elsewhere, in commodities, the price of crude oil, gold, silver, and copper have fallen by more than 1%. The only hiding place is in the CBOE VIX index and the dollar index that are up by more than 0.10% and 0.40%, respectively.
DAX Index, Dow, Nikkei 225, and most global stocks fall

In its FOMC decision yesterday, the Federal Reserve left interest rates at the ultralow level of 0.0% and 0.25%. The bank also left the quantitative easing policies unchanged. Most importantly, as a survey by CNBC had predicted, the bank’s officials signalled that the interest rates will remain this low until 2023.
But why are global indices like the Dow Jones falling? It is, I believe, a classic scenario of buying the rumour and selling the news. As we had written before, most analysts were indeed expecting that the Fed would turn dovish in this meeting. Furthermore, Jerome Powell had sent the same signal at his speech at the virtual Jackson Hole summit.
In addition, the decline in global stocks is probably because the Fed did not unveil new measures to support the economy even though congress has failed to pass a stimulus package.
Global stocks are also falling because of a major car retail sales data from Europe. A report by the association of auto retailers showed that new passenger car registrations declined by 18% in August, ending a three-month winning streak for the sales. That will be a significant mover in the DAX index, which has some of the biggest automakers in Europe.
Dow Jones technical outlook
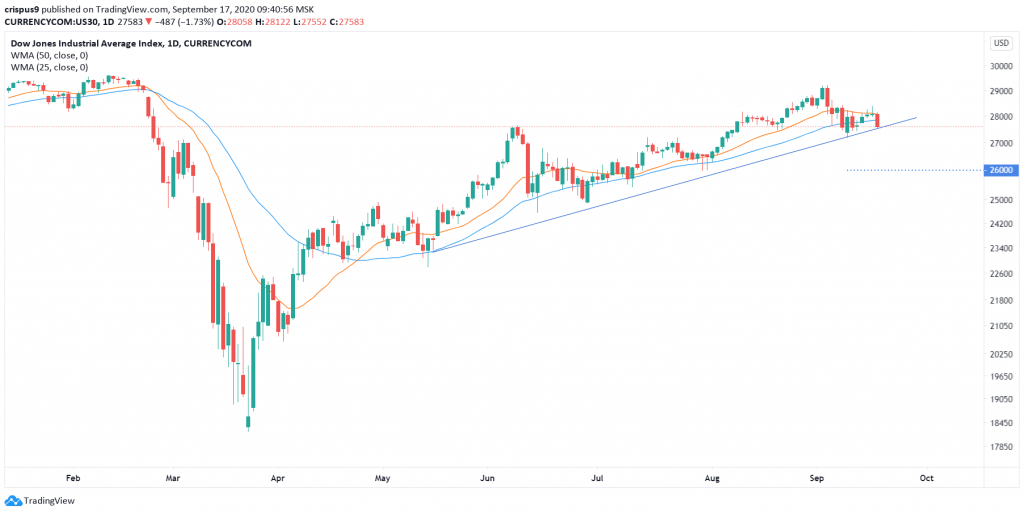
The daily chart shows that the Dow Jones was up in the past three consecutive days during the build-up of the Fed decision. The index tumbled in overnight trading and is now trading at $27,600. On the daily chart, the price is still above the ascending trendline that connect the lowest levels in May, June, July, and September. The price is also slightly below the 50-day and 25-day weighted moving averages.
Therefore, I suspect that the bullish trend will resume so long as the index is above the ascending trendline. If it moves below the line, it will send a signal that there are still more bears in the market who will be keen to push it below $27,000.
Dow Jones Daily Chart


