- Summary:
- LTC price has been in a slump since its halving. The price has formed a bearish market structure and may target $40 in the coming weeks.
Short-term traders who accumulated Litecoin (LTC) in anticipation of a major post-halving pump have met an utter disappointment. Litecoin price has reacted to the exact opposite of what every bullish analyst expected before the halving.
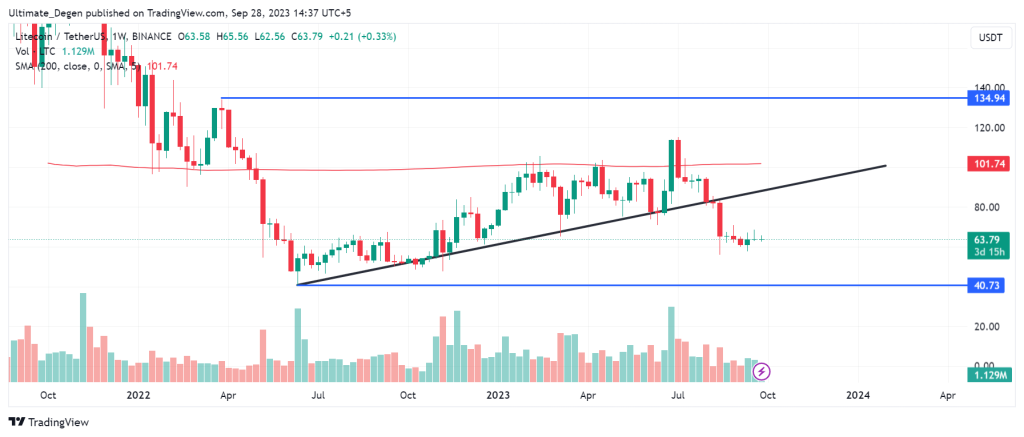
LTC price peaked at $114 in June 2023, almost one and a half months before the halving in block reward. Since then, the coin has been in a tailspin while also breaking the bullish market structure. At the time of writing, Litecoin is changing hands at $63.96 after rising 0.66% for the day.
In the past couple of years, Litecoin has really lost its spot as the digital silver due to the decrease in investor interest in the project. Many new projects with better fundamentals have taken the market share from Charlie Lee’s brainchild.
Consequently, the digital asset, which was once among the top 3 cryptocurrencies, has now slid to 15th place in terms of market capitalization. After an 84.4% drop from its all-time high, Litecoin price is facing some serious headwinds without any signs of a recovery.
In May 2022, the LTC price broke below the 200 MA on the weekly chart, gaining a long-term bearish outlook. In June 2023, the price broke above the key moving average but failed to gain any momentum. This has put the possibility of new yearly lows on the cards.
Litecoin Price Analysis & Prediction

I’ll keep sharing updated Litecoin analysis and my personal trades on my Twitter, where you are welcome to follow me.
For this article, I’ve opted to analyze the weekly chart instead of the daily chart. This is because the weekly timeframe removes the noise and often gives a much clearer picture. It can be seen on the chart above that the price has broken below the uptrend line while making a lower low.
This means a breakdown of the bullish market structure, flipping Litecoin price prediction bearish. Sooner or later, I expect the price to retest the last year’s lows of $40. While a short-term bounce may occur anytime, the long-term trend remains to the downside.


