
- In this article, we will learn what AMD is as a market cycle for institutional order flow, how to use the accumulation, manipulation, and distribution phases to identify retail traps, and the key differences between the AMD framework and Wyckoff’s market theory for intraday trading.
Market movements are rarely as random as they appear on a surface level. Behind the price action seen on a retail chart lies a sophisticated lifecycle of order execution driven by institutional liquidity. One of the most effective frameworks for decoding this behavior is the Accumulation, Manipulation, and Distribution (AMD) model.
Also known as the “Power of 3,” this concept, popularized by Michael J. Huddleston (ICT), is a refined evolution of Wyckoff’s market theory. It provides a roadmap for how “Smart Money” engineers liquidity to enter and exit large positions without moving the market against themselves.
The anatomy of the AMD cycle
To master how to use accumulation, manipulation and distribution in trading, you must first understand the psychological and mechanical purpose of each phase.
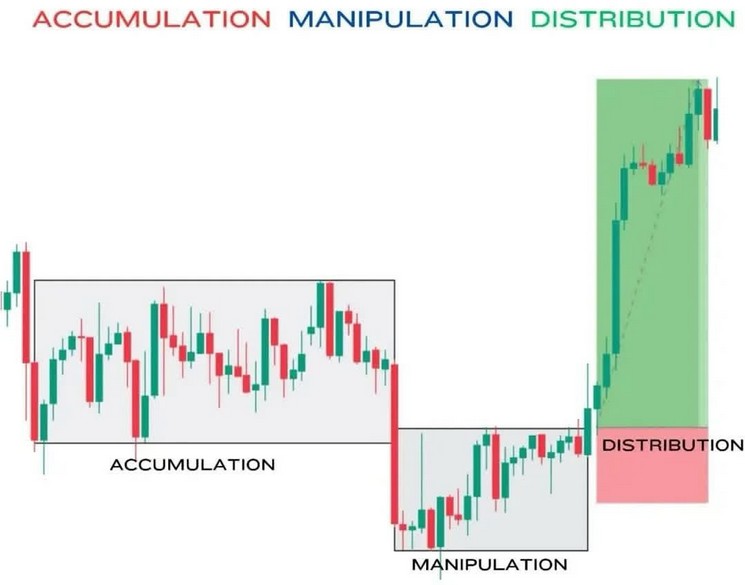
1. Accumulation: the building of orders
Accumulation is the baseline of the cycle. It appears as a tight consolidation or sideways range where price action seems directionless.
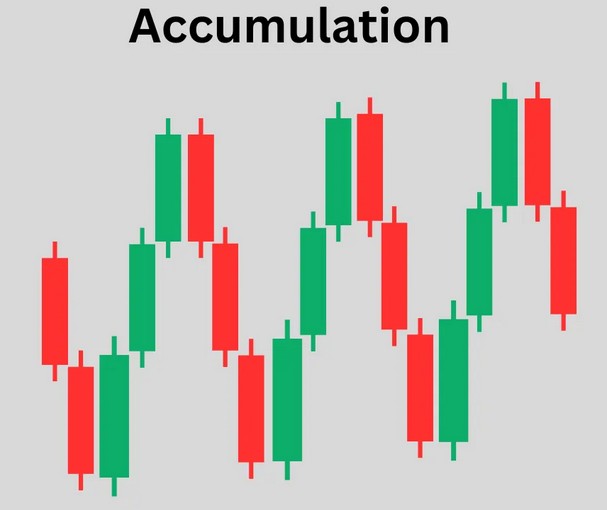
- The mechanics: During this phase, institutional players are quietly “loading the boat.” Because their orders are too large to execute at once, they buy or sell in small increments within a defined range.
- Retail trap: Retail traders see this lack of volatility and place buy stops above the range and sell stops below it. This concentration of stop-loss orders creates exactly what the institutions need for the next phase: Liquidity.
2. Manipulation: the liquidity hunt
The manipulation phase is a violent, deceptive move that pushes price sharply out of the accumulation range, only to reverse almost immediately.
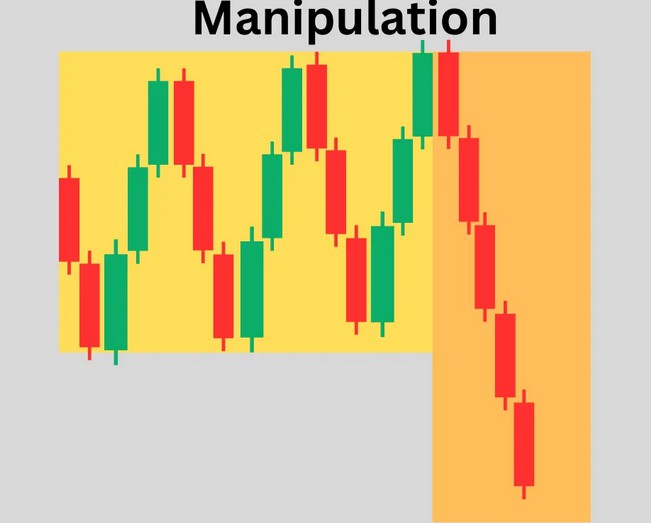
- The mechanics: This is a “Judas Swing” designed to trick the market. By pushing price past the accumulation boundaries, institutions trigger the stop-losses of range traders and induce breakout traders to enter the wrong side of the market.
- The objective: These triggered stops become “market orders” that provide the counter-party liquidity necessary for the Smart Money to fill their true, large-scale positions at a premium or discount.
3. Distribution: the trend expansion
Once the traps are set and the retail liquidity is harvested, the market enters the distribution phase. This is the “true” move of the day or session.
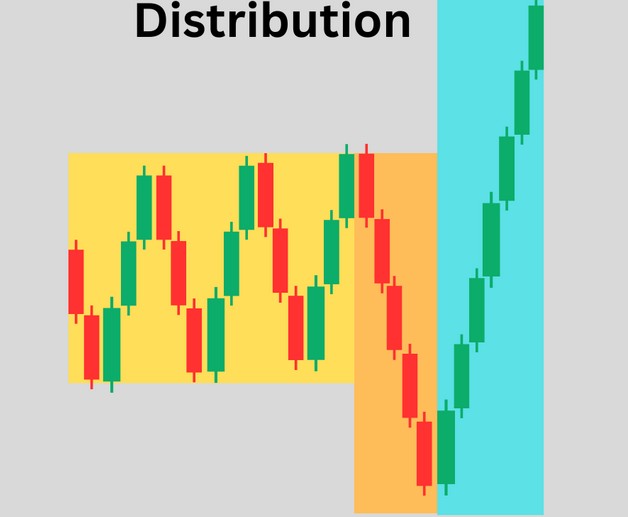
- The mechanics: Price moves with high momentum and increasing volume in the opposite direction of the manipulation.
- The result: This phase is typically the longest and most profitable. It represents the institutions pushing the price toward their target value areas to offload (distribute) their positions to retail traders who are now chasing the trend too late.
How to identify the AMD setup
Spotting AMD in real-time requires a top-down approach and an understanding of session timing.
Step 1: establish the daily bias
You cannot trade AMD in a vacuum. Use higher timeframes (H1 or H4) to determine the overall trend. If the higher timeframe bias is bullish, you are specifically looking for an AMD setup where the manipulation sweeps the lows of the accumulation range before distributing upward.
Step 2: time the sessions
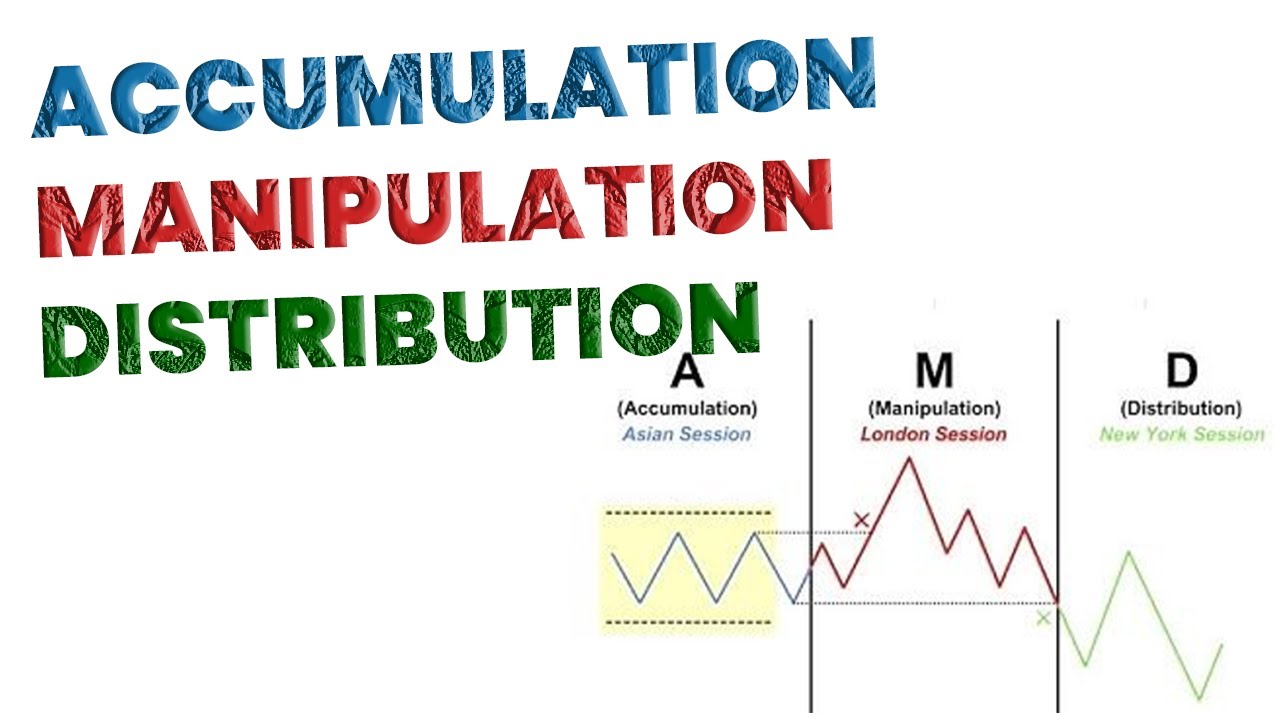
The “Power of 3” is most potent when aligned with market opens:

- Asian session: Typically acts as the Accumulation phase, setting the initial range of the day.
- London open: Frequently serves as the Manipulation phase. Look for a sweep of the Asian range highs or lows during the first two hours of the London session.
- New york session: Often acts as the Distribution phase, where the market expands toward the daily profit targets.
Step 3: identify the market structure shift (MSS)
To confirm the transition from manipulation to distribution, look for a shift in market structure on a lower timeframe (M1 or M5). When price sweeps the range and then aggressively breaks a recent swing high/low, it confirms that the Smart Money has successfully filled their orders.
What’s the difference between AMD and Wyckoff’s theory ?
While both models focus on institutional flow, the AMD framework is more “agile” for modern intraday trading. Wyckoff’s theory was originally designed for the stock market’s longer-term cycles (weeks and months). In contrast, AMD/Power of 3 is optimized for the high-frequency environment of Forex and Crypto, where these cycles play out daily on 15-minute and 1-hour charts.
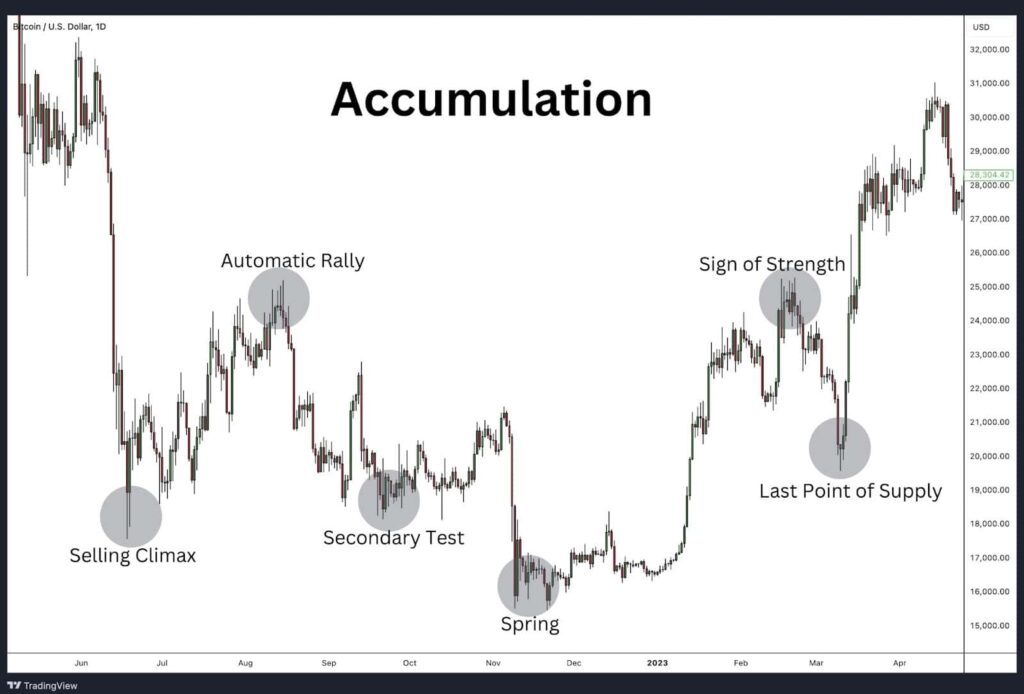
Image showing the Wyckoff Accumulation stages, Selling Climax, Automatic Rally, and Secondary Test
Risk management and entry tactics
Knowing how to use accumulation, manipulation and distribution in trading is only half the battle; execution is where the edge lies.
- Don’t trade the accumulation: There is zero benefit in trying to predict the breakout of a sideways range. You will likely be “chopped up” by minor fluctuations.
- Entry trigger: The optimal entry is during the “Reclaim.” Wait for the manipulation to sweep liquidity, then enter when the price moves back into the accumulation range with a stop-loss placed just beyond the manipulation wick.
- Targeting: Aim for the opposite side of the accumulation range as your first target, with secondary targets at major daily or weekly liquidity pools.
Conclusion: turning the AMD cycle into a real trading edge
The AMD cycle is a reminder that the first move you see is rarely the real move. By shifting your perspective from a reactive retail trader to a student of institutional liquidity, you can stop being the “target” and start following the “Smart Money.”
Mastering the AMD cycle gives you the directional edge, but an edge is only as good as the infrastructure supporting it. To capitalize on institutional footprints, you need a broker that handles your orders with the same precision.
ATFX provides the institutional-grade environment required to execute the AMD framework effectively. With ultra-low latency, deep liquidity to minimize slippage during volatile distribution phases, and the technical tools needed to map out order flow, ATFX ensures that when the “Smart Money” moves, you are positioned to move with them.
To use AMD effectively, identify a consolidation range (Accumulation), wait for a deceptive breakout that sweeps liquidity (Manipulation), and enter a trade when price reverses aggressively back through the range toward the true trend (Distribution). Timing these phases with major session opens like London or New York increases accuracy.
Accumulation and distribution are used to identify where institutional “Smart Money” is entering or exiting the market. Traders use accumulation zones to spot where orders are being built and distribution zones to find high-momentum trends. Aligning your trades with these phases ensures you are trading with institutional flow rather than against it.
In the context of market cycles and timing, the 3-6-9 rule often refers to specific hourly intervals or session windows where volatility is expected to peak. In AMD trading, this frequently aligns with the 3 AM (London Open) and 9 AM (New York) windows, which are prime times for the manipulation and distribution phases to trigger.
