- Summary:
- Two months ago, the Kadena price was $1.00 with a market cap of 120m. Today KDA tokens are changing hands at $20 and a market cap of $3b.
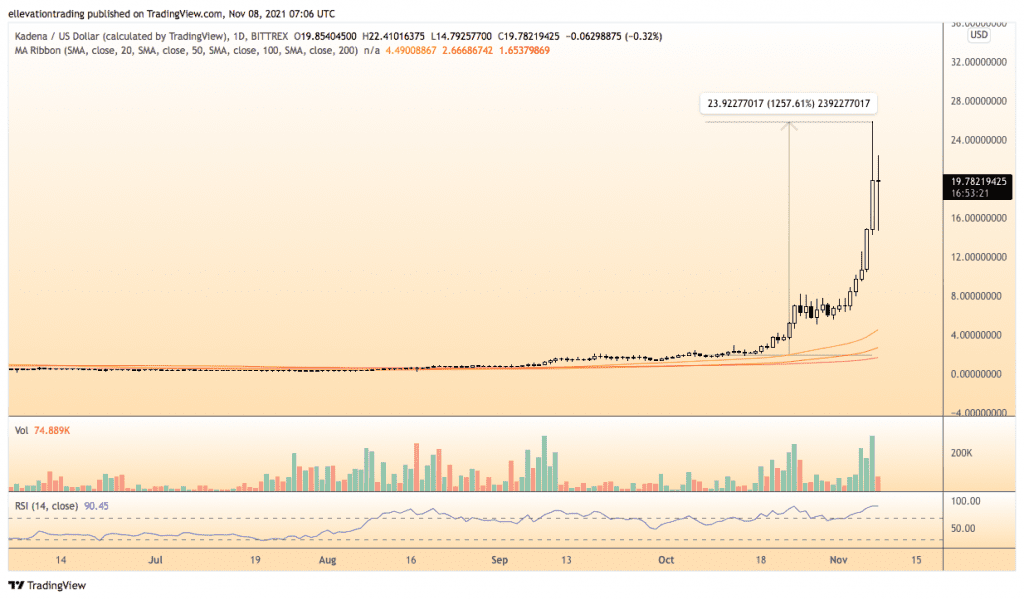
Two months ago, the Kadena price was $1.00 with a market cap of 120m. Today KDA tokens are changing hands at $20 and a market cap of $3b. Kadena (KDA) has pulled back around 22% from Sunday’s $25.95 high. But despite the correction, it still shows a two-month gain of 950%. The layer-1 blockchain is now the 55th most valuable cryptocurrency and worth more than Stacks (STX) and Quant (QNT).
Layer-1 blockchain Kadena was started by two former JP Morgan executives, who previously led the banks’ blockchain team, and similar to Solana and Avalanche that has set its sight on Ethereum’s crown. The network claims to handle 480,000 transactions per second (TPS), far superior to Ethereum’s 14 TPS and Solana’s 50,000. As a result, investors have switched their attention to Kadena’s native KDA token over the last month, causing the Kadena price to generate outsized returns. But whilst the platform boasts an impressive CV, the question I am asking myself is what’s changed since September apart from the price?
KDA price Analysis
The daily chart shows that Kadena has gone vertical in the last couple of days. As you can see, the KDA token flat-lined for most of the year and only started to catch a bid in October. As a result, the Relative Strength Index reads 91.50, indicating the rally is incredibly overdone.
Logically, an RSI of 91.50 suggests an imminent reversal. However, since when have cryptocurrencies been logical? On that basis, I cannot measure if the price will continue higher or collapse in the near term. Although in my experience, parabolic rallies normally end in spectacular (violent) fashion.
Therefore, investors should exercise caution at the current level. This does not mean the Kadena price won’t go higher but will be vulnerable to shocks lower, as we saw yesterday.
Kadena Price Chart (daily)

For more market insights, follow Elliott on Twitter.


